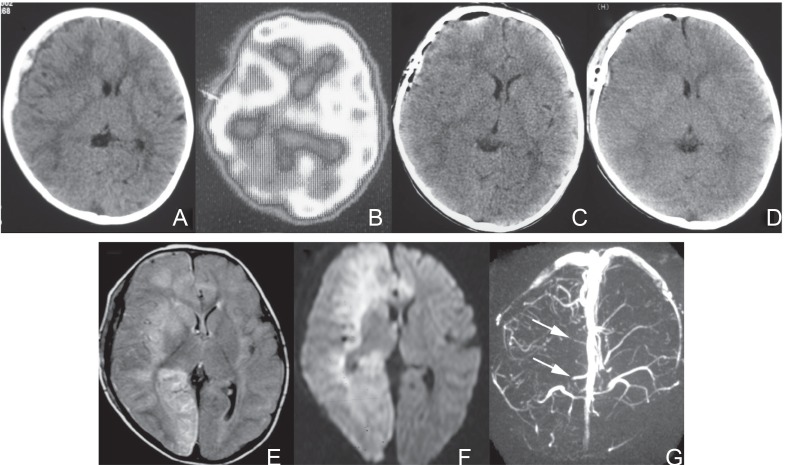
Fig. 3.
Images of Case 8. A: A computed tomogram (CT) at admission showing a right acute subdural hematoma with a mid-line shift. B: A single photon emission CT on Day 0 demonstrating a decrease in blood flow in the right hemisphere. C: A CT performed 6 hours after admission and immediately after hematoma removal. No apparent abnormality is demonstrated in the brain parenchyma and the mid-line shift improves. D: A CT on Day 2 showing no apparent cerebral infarction. E: A magnetic resonance (MR) image/fluid-attenuated inversion recovery (FLAIR) on Day 4 showing high intensity lesions in the right frontal lobe, right basal ganglia, right occipital lobe, and the left frontal lobe. The cerebral infarction associates with brain swelling. F: An MR image/diffusion weighted image on Day 4 demonstrated high intensity lesions in the right frontal lobe, right basal ganglia, right occipital lobe, and the left frontal lobe. G: An MR venogram on Day 4 showing scarce cortical veins in the right hemisphere (arrows).

