Fig. 5.

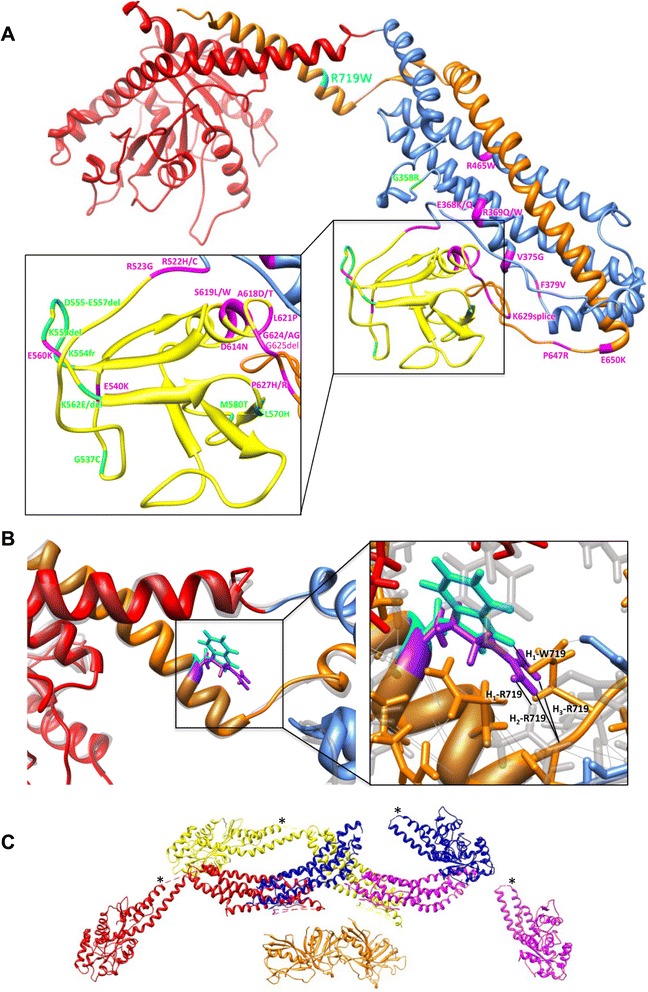
Structural modeling of dynamin 2 c.2155C > T, p.R719W mutation. a Molecular model of dynamin 2 based on the crystal structure of dynamin 1 [22] indicating the HSP p.R719W mutation (cyan), CNM mutations (magenta) and CMT mutations (green). Dynamin domains are colored as follows: GTPase domain (red), Middle (blue), PH (yellow) and GED (orange). p.R719W is located at the hinge region between the BSE (a three helix bundle consisting of N and C termini of the G domain and the C termini of GED) and the stalk (Middle and GED) of dynamin. Generated by I-TASSER. b Overlay of wild-type and p.R719W dynamin 2 molecular models with R719 (purple) and W719 (cyan) side chains shown. On the right panel: there are three putative H bonds connecting R719 to the rest of the molecule (labeled H1–3-R719) compared to only one for W719 (H1-W719). c The assembled tetramer of dynamin 1 was generated from docking crystal structures into a 3D density map of K44A-dynamin 1 [24]. Dynamin monomers are colored red, yellow, blue and purple. Asterisks indicate the location of R725W (equivalent to R719W in dynamin 2) in the assembled dynamin 1
