
Fig. 1.
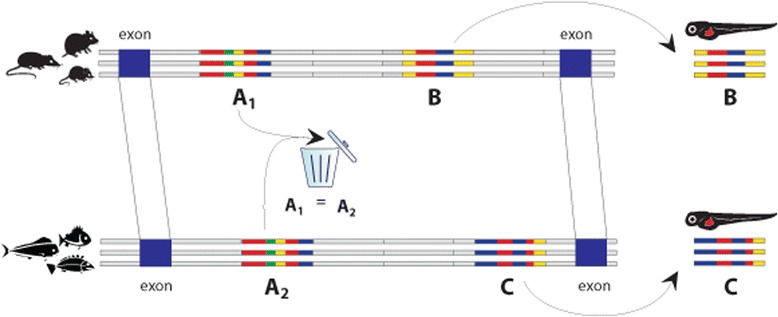
Scheme of the analysis of orthologous introns bracketed by the orthologous exons in the rodent/rabbit and fish evolutionary groups of genomes. Conserved sequences (A1 and B, and A2 and C in multiple alignments of the groups 1 and 2 respectively) are compared, and highly similar A1 and A2 removed from the analysis. Sequences B and C are selected for experimental validation