
Fig. 4.
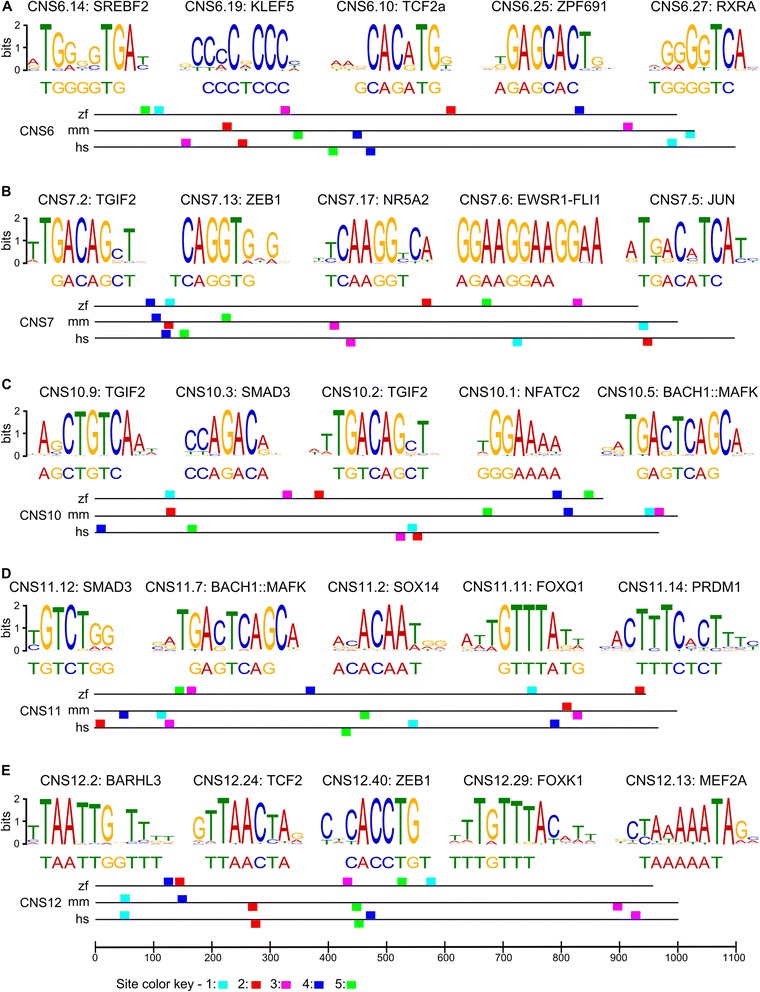
Transcription factor binding sites detected in the five syntenic ECRs. a-e: each panel shows the five motifs with most significant E-value in the given ECR, and the sequence of the n-mer, identical in the zebrafish, mouse, and human sequence of the ECR, from which the motif was identified. The name of the transcription factor binding to a motif is shown above the motif, and the sequence of the motif is shown for the strand on which the n-mer was found. The arrangement of the motifs along the zebrafish (zf), mouse (mm), and human (hs) sequences is shown at the bottom of each panel (the scale, in base pairs, is the same for all panels and shown only for panel E). Motifs are color-coded according the legend at the bottom of the figure; motifs shown above and below the reference line are identified on the forward and reverse strands, respectively