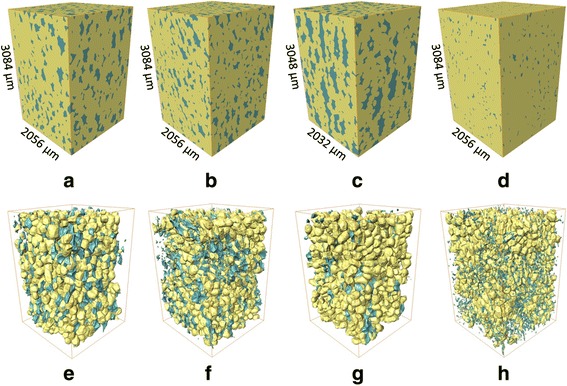
Fig. 2.

Bulk microstructure model of ‘Braeburn’ (a), ‘Kanzi’ (b), ‘Jonagold’ (c) apple and ‘Conference’ (d) pear tissue, and 3D model of the same samples resp. e f g h after the automatic isolation protocol for cells (yellow) and voids (blue). The dimensions of the analyzed datastacks are presented in μm, and are the same for the bulk microstructure models as for the isolated void and cell models
