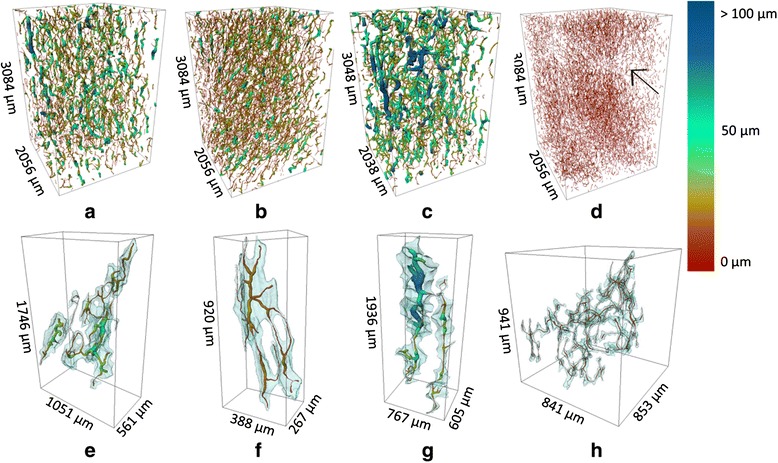
Fig. 4.

Void network models for ‘Braeburn’ (a), ‘Kanzi’ (b), ‘Jonagold’ (c) and ‘Conference’ (d) showing void topology and void network branching as well as local thicknesses of the voids expressed by the color scale. The arrow in the ‘Conference’ image indicates the presence of a stone cells, with a local absence of surrounding voids. Details of the void network models for a single void, show the original void volume (transparent blue) and the calculated void network. For these models, large void volumes were chosen to illustrate the void connectivity. The dimensions of the box illustrate the spatial extent of the void network. Plots e to h present a single connected void in each of the corresponding void networks in plots a to d, demo,strating variations in size and connectivity
