
Fig. 4.
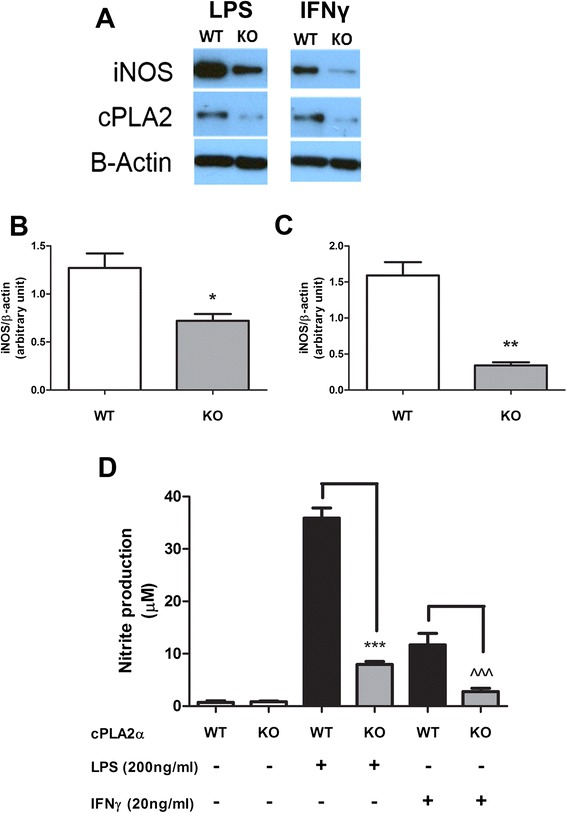
iNOS expression and NO production were significantly reduced in cPLA2 KO primary microglia culture compared with WT culture. DIV5–7 primary microglia culture isolated from cPLA2 KO or WT mice were stimulated with 200 ng/mL LPS or 20 ng/mL IFNγ for 24 h. Cells were then lysed, and proteins were collected/processed. a iNOS/cPLA2/β-actin expressions were demonstrated by Western blot, and b, c iNOS/ β-actin levels were quantified with the QuantityOne software. Results were expressed as the mean ± SEM (n = 3), and significant difference between the respective paired groups was determined by t test, *P < 0.05; **P < 0.01. d Conditioned mediums from 48 h post-stimulation samples were collected for determination of nitrite concentration with the Griess protocol. Results were expressed as the mean ± SEM (n = 3) and significant difference between the respective groups was determined by t test, ***P < 0.001; ^^^P < 0.001