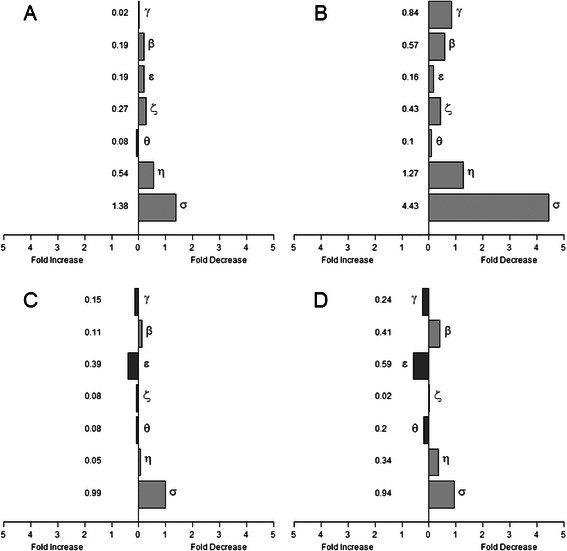
Fig. 2.

Ratio of 14-3-3 gene expression between tumor and non-tumor sample groups. a 14-3-3 expression level comparison of total tumor population with total non-tumor population. Values represent fold difference in the average level of 14-3-3 expression of all 71 tumor samples compared to the average expression level of all 52 non-tumor samples. Fold change = 2|ΔΔCt|-1, where ΔΔCt was calculated from the mean of tumor and non-tumor group ΔCt values for each isoform. b 14-3-3 expression level comparison of tumor and non-tumor matched pairs. ΔCt values of tumor and non-tumor samples taken from the same patient were compared to each other (ΔΔCt) for eleven matched pairs. Values indicated the average fold difference (2|ΔΔCt|-1) in expression of each 14-3-3 isoform. c 14-3-3 expression level comparison of total tumor population with total non-tumor population of TCGA COAD Dataset. d 14-3-3 expression level comparison of tumor and non-tumor matched pairs of TCGA COAD Dataset
