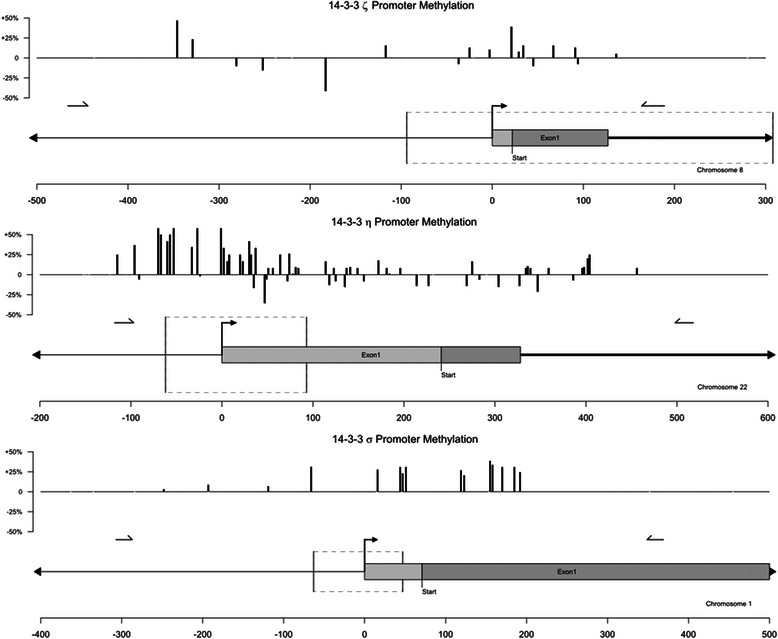
Fig. 4.

Changes in methylation status of 14-3-3 sigma, eta, and zeta promoter regions. Relative changes in methylation status for each identified CpG site are plotted for all three genes. Upward-facing bars indicate tumor hypermethylation at a particular CpG site, while downward-facing bars indicate hypomethylation. The relative positions of transcriptional start sites and first exons are shown below methylation maps for each isoform. Scales in units of base pairs up or down-stream are shown for reference. Short, horizontal arrows indicate the recognition sites of the forward and reverse primers used to amplify each region. Lightly shaded bars indicate the first exon of each 14-3-3 gene. Start codons for 14-3-3 sigma and eta genes are also shown for reference (coding regions are shown with dark shading). Boxes outlined by dashed lines indicate likely CpG islands (as determined computationally by EMBOSS Cpgplot)
