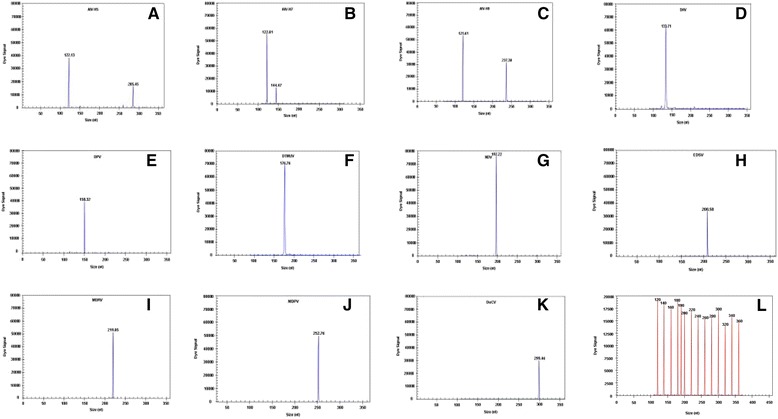
Fig. 1.

Specificity analyses of the GeXP-PCR assay. The Y-axis indicates the dye signal in A.U., and the X-axis indicates the actual PCR product size. a–k show the results of the amplification of AIV-H5, AIV-H7, AIV-H9, DHV, DEV, DTMUV, NDV, EDSV, MDRV, MDPV, and DuCV, respectively. Nuclease-free water was used as the negative control (l). The red peaks indicate the DNA size standard
