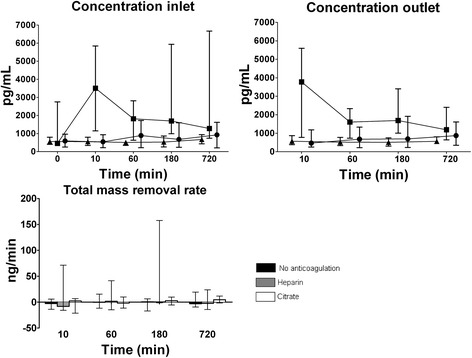
Fig. 1.

Concentration (median and interquartile range) of TWEAK during CVVH over time at inlet (before addition of replacement fluid) and outlet and the total mass removal rate. Symbols: ● no anticoagulation, ■ heparin, ▲ citrate. Concentrations at inlet and outlet were higher in the heparin group (P = 0.043 and P = 0.001, respectively) and decreased over time as compared to the other groups (P = 0.001 and P = 0.007, respectively)
