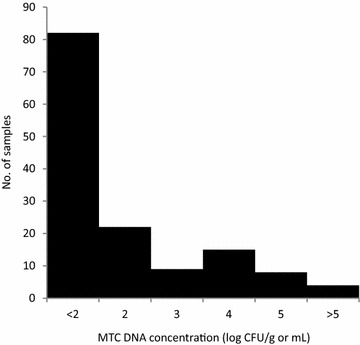
Figure 2.

Distribution of the estimated Mycobacterium tuberculosis complex concentrations. Distribution of the MTC DNA concentrations (as log CFU/g or mL) in the oro-nasal and bronchial-alveolar lavages and fecal samples in which MTC DNA was amplified (n = 140), both host species combined. MTC DNA concentrations were estimated based on the calibration line between log-transformed inoculated BCG concentrations (CFU/g or mL) and MPN concentration estimates (MPN/g or mL).
