Fig. 4.

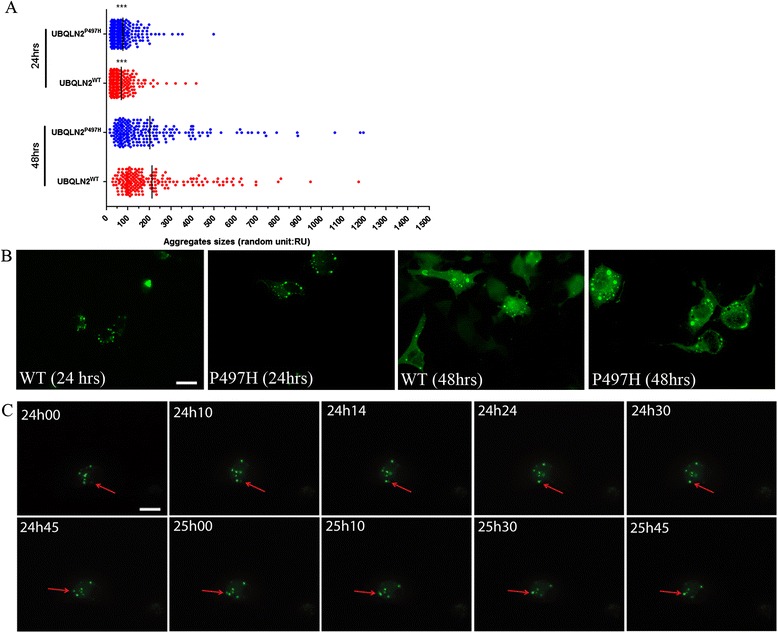
hUBQLN2 inclusions were dynamic. a Immunofluorescence of GFP-labeled hUBQLN2 proteins at 24 h and 48 h after transfection of Neuro2A cells with pFeGFP-hUBQLN2WT or pFeGFP-hUBQLN2P497H was used to measure the size of inclusions (>200 aggregates, p < 0.0001). Fifty cells per group were examined. b Immunofluorescence showing representative pictures at each time point (magnification at 63×). c Live imaging was done on Neuro2A pFeGFP-hUBQLN2P497H transfected cells. Pictures were taken each minute over a 2 h period starting at 24 h post-transfection. Red arrow is showing moving aggregates (Additional file 2: Move S1). Scale bar = 25 μm
