
Fig. 2.
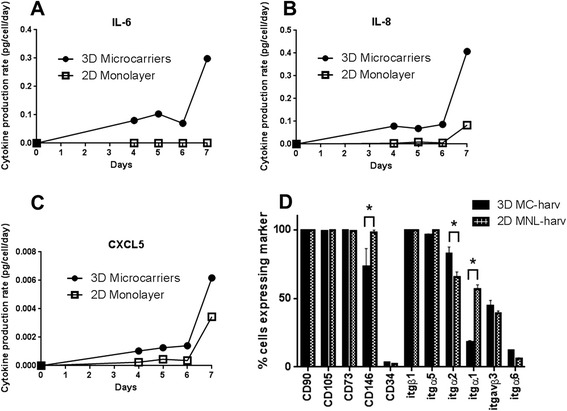
Phenotype of S27 hfMSCs expanded on 2D MNL or on Cytodex 3 microcarriers (3D MC) in a spinner flask. Profile of cytokine production rates for (a) IL-6, (b) IL-8 and (c) CXCL5 as measured by ELISA during the 7-day expansion. d Cell surface marker expression of MSC harvested from 2D MNL and 3D MC expanded cultures measured by flow cytometry. *p < 0.05 for 3D MC-harv compared to 2D MNL-harv by 2-tailed t-test in Graphpad