
Fig. 5.
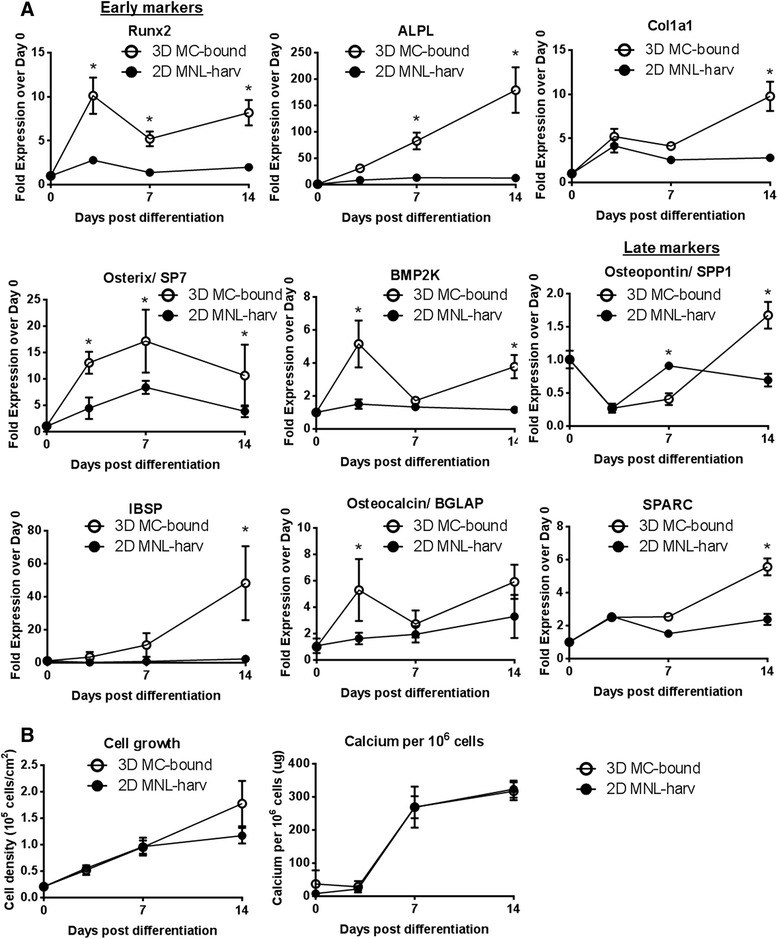
Kinetics of gene expression, early and late markers, cell growth and calcium deposition during osteogenic differentiation of collagen I-coated plates seeded with monolayer-harvested (2D MNL-harv) or microcarrier-bound (3D MC-bound) S27 hfMSCs. a Osteogenic gene expression values normalized to Day 0 post-differentiation (*p < 0.05 and >2-fold difference). N = 3 biological replicates per condition. b Cell growth (cell density in 105 cells/ cm2) (left) and calcium deposition per 106 cells (right), (*p < 0.05). N = 3 biological replicates per condition. Two-way repeated measures ANOVA with post-hoc Tukey correction was performed between 3D MC-harv, 2D MNL-harv and 3D MC-bound cells using Graphpad. Of the multiple comparisons performed, data representing a single comparison (3D MC-bound vs 2D MNL-harv) is shown in part (a) and (b) in this figure