Fig. 2.

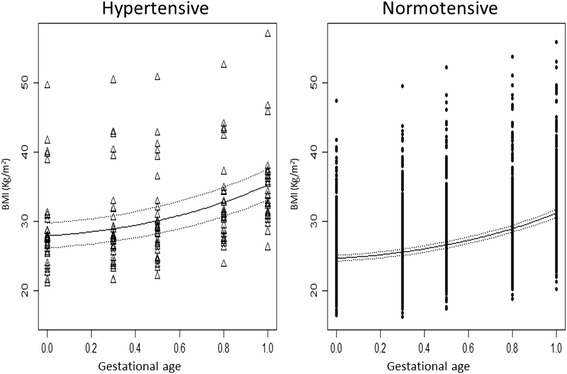
Expected body mass index (BMI) over time in the hypertensive (triangles) and normotensive (circles) women. The 95 % confidence intervals for the respective predictions are indicated (dashed lines)

Expected body mass index (BMI) over time in the hypertensive (triangles) and normotensive (circles) women. The 95 % confidence intervals for the respective predictions are indicated (dashed lines)