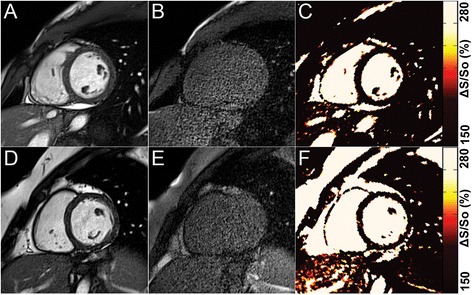
Fig. 1.

a-c Representative data from a healthy control. End-diastolic reference bSSFP images acquired with (a) 45° and (b) 5° flip angles provide MT-weighted and proton density reference images, respectively. (c) Maps of ΔS/So that are calculated from A and B demonstrate uniform and low values throughout the heart. d-f Representative data from a patient without LGE. End-diastolic reference bSSFP images acquired with (d) 45° and (e) 5° flip angles. This patient demonstrated no myocardial enhancement at LGE. (f) Map of ΔS/So demonstrates uniformly low values similar to the healthy control. For all maps, the color scale was chosen to emulate LGE imaging, with areas of edema/fibrosis demonstrating signal enhancement and areas of healthy tissue appearing dark
