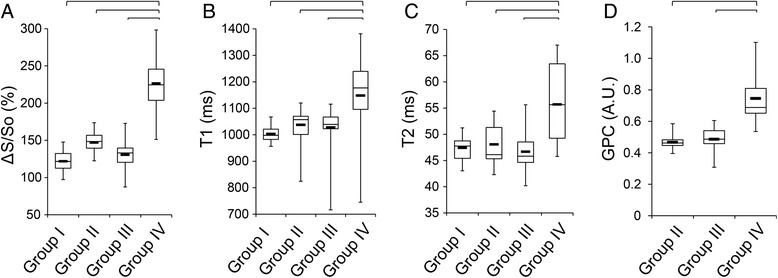
Fig. 5.

Tissue characterization parameters. (a) ΔS/So was significantly elevated in tissue regions that enhanced on LGE images (Group IV) compared to non-enhanced regions from the same patients (Group III), patients without any LGE (Group II), and healthy controls (Group I). Similarly, (b) native-T1 and (c) native-T2 were significantly elevated in tissue that enhanced on LGE images compared to all other groups. (d) GPC was significantly higher in tissue that enhanced on LGE images compared to non-enhanced tissue regions in patients. (Lines represent p < 0.05)
