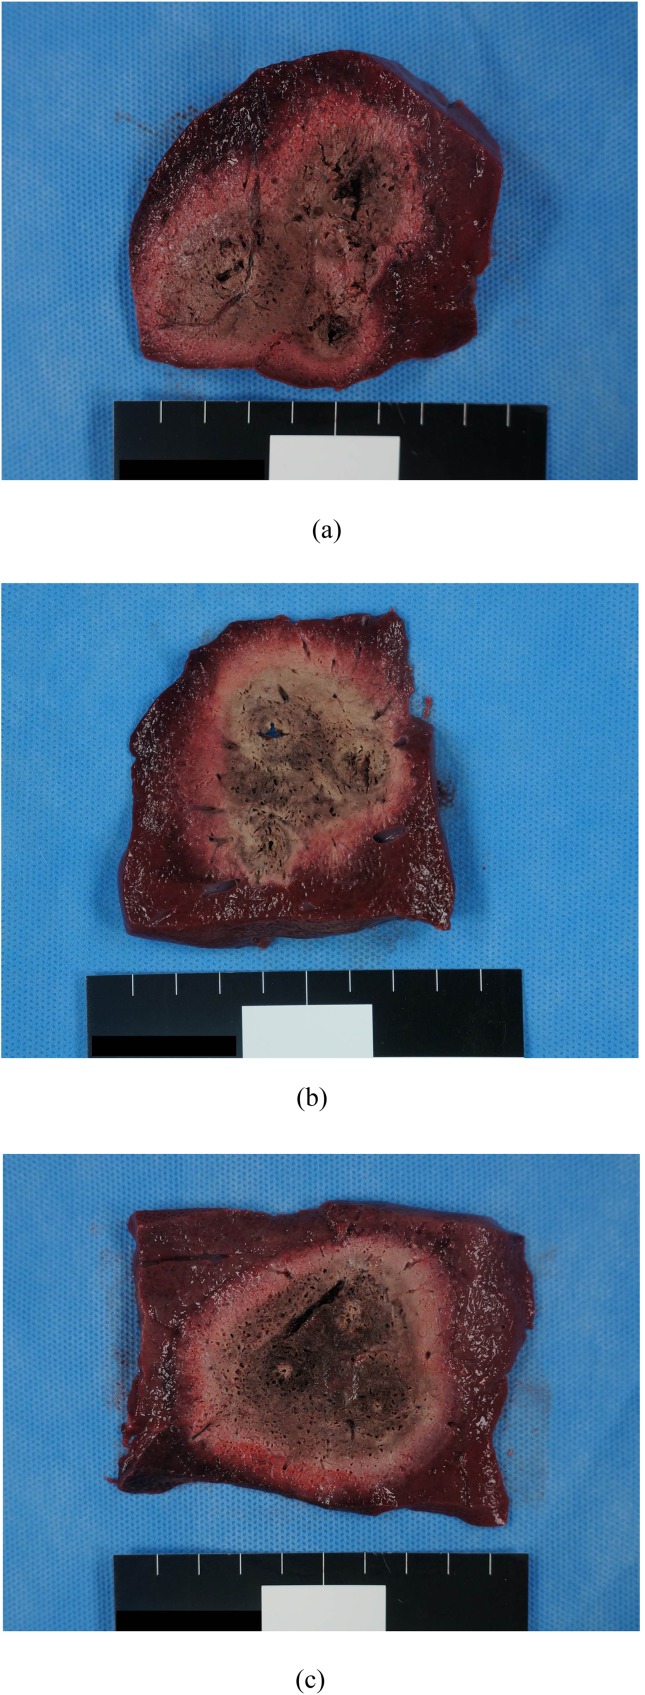
Figure 4.
Comparison of the radiofrequency (RF)-induced coagulations of the consecutive monopolar (CM), switching monopolar (SM) and switching bipolar (SB) groups. (a) Photograph of the cut surface of the coagulation created by CM-RF ablations demonstrates a 3.5 × 6.9-cm-sized, confluent ablation zone with an irregular shape. Note that the size of each ablation zone along the three electrodes is relatively different. (b) Photograph of the cut surface of the coagulation created by SM-RF ablation demonstrates an oval-shaped, 4.5 × 5.3-cm ablation area with an irregular margin. (c) Photograph of the cut surface of the coagulation created by SB-RF ablation demonstrates an oval-shaped, 6.1 × 6.5-cm ablation area with a sharp margin. Note that the size of each ablation zone along the three electrodes is relatively the same.

