Abstract
Objective:
To determine the optimal diagnostic criterion of dynamic contrast-enhanced MRI (DCE-MRI) for predicting salivary gland malignancy using a dynamic sequence with high temporal resolution, as well as the accuracy of this technique.
Methods:
The DCE-MRI findings of 98 salivary gland tumours (74 benign and 24 malignant) were reviewed. MR images were sequentially obtained at 5-s intervals for 370 s. Two parameters, peak time and washout ratio (WR) were determined from the time–signal intensity curve. The optimal thresholds of these parameters for differentiating benign and malignant tumours were determined, along with the diagnostic accuracy of the criterion using these thresholds.
Results:
A peak time of 150 s and a WR of 30% were identified as optimal thresholds. As the criterion for malignancy, the combination of peak time <150 s and WR <30% provided a sensitivity of 79% (19/24), specificity of 95% (70/74) and an overall accuracy of 91% (89/98). Three of the five false-negative cases were malignant lymphomas of the parotid gland.
Conclusion:
Peak time <150 s with WR <30% comprised the optimal diagnostic criterion in predicting salivary gland malignancy, providing a sensitivity of 79% and specificity of 95%. The use of high temporal resolution might improve the accuracy of DCE-MRI.
Advances in knowledge:
Although several studies have reported the usefulness of DCE-MRI in the differential diagnosis of salivary gland tumours, the specific diagnostic criteria employed have differed widely. We determined the optimal criterion and its accuracy using a dynamic sequence with high temporal resolution.
Salivary gland tumours account for approximately 3% of all tumours.1 They can arise from any salivary gland, although the majority occur in the parotid gland.2 Pre-operative differential diagnosis between benign and malignant salivary gland tumours is very important because the results strongly affect surgical treatment planning. Among various imaging techniques, MRI is now the modality of choice for evaluation of suspected salivary gland tumours.3,4 Owing to its superb contrast resolution and multiplanar facilities, MRI can clearly identify a tumour's exact location and extent, as well as its relationship with neighbouring structures. On the other hand, the sensitivity of conventional MRI in predicting malignancy is known to be quite low.5–7
Several researchers reported that time–signal intensity curves (TICs) obtained by dynamic contrast-enhanced MRI (DCE-MRI) were useful in the differential diagnosis of salivary gland tumours and that the TIC characterized by early enhancement and low washout was associated with malignancy.4,8–15
However, the specific criteria involved, that is, the definition of and thresholds for the time to peak enhancement and the washout ratio (WR), have varied widely among studies. Thus, the efficacy of DCE-MRI in the differential diagnosis of salivary gland tumours has not yet been fully established. To obtain accurate TICs, a dynamic MRI sequence with high temporal resolution should be used.6,16 However, the temporal resolution in most of the previous studies was relatively low (15–60 s),8–12,14,17–20 which may partly explain the inconsistencies between reports.
In this study, we applied DCE-MRI with a temporal resolution of 5 s to 98 cases with salivary gland tumours. Our aims were to evaluate the TICs of these cases and to determine the optimal diagnostic criteria for DCE-MRI as well as its accuracy in differentiating benign from malignant salivary gland tumours.
METHODS AND MATERIALS
The protocol of this study was approved by the institutional review board of Tokyo Dental and Medical University (number 880).
Patients
We reviewed the imaging studies of 98 consecutive patients with histopathologically confirmed salivary gland tumour who were evaluated at Tokyo Dental and Medical University Dental Hospital (Tokyo, Japan) with MRI, including DCE-MRI, between February 2003 and December 2012. The patients comprised 36 males and 62 females with a mean age of 53 years (age range, 17–82 years). After MRI, all tumours were surgically removed and histopathologically examined. The histopathological diagnosis and the origin of the 98 tumours are shown in Table 1. 74 cases were benign, whereas the other 24 were malignant. The former included seven cases of parotid cyst, because they were clinically indistinguishable from parotid gland tumours. The latter consisted of 21 carcinomas and 3 malignant lymphomas. Concerning the origin of the tumours, the most common gland was the parotid, followed by the minor salivary gland in the oral cavity.
Table 1.
Histopathological diagnosis and origin of the 98 salivary gland tumours (number of cases)
| Diagnosis | Parotid gland | Submandibular gland | Sublingual gland | Minor salivary gland | |
|---|---|---|---|---|---|
| Benign | 74 | 40 | 9 | 1 | 24 |
| Pleomorphic adenoma | 53 | 21 | 9 | 23 | |
| Warthin tumour | 10 | 10 | |||
| Basal cell adenoma | 1 | 1 | |||
| Myoepithelioma | 3 | 1 | 1 | 1 | |
| Lymphoepithelial cyst | 7 | 7 | |||
| Malignant | 24 | 6 | 5 | 2 | 11 |
| Adenoid cystic carcinoma | 8 | 2 | 1 | 1 | 4 |
| Mucoepidermoid carcinoma | 5 | 1 | 4 | ||
| Adenocarcinoma | 3 | 1 | 1 | 1 | |
| Carcinoma ex pleomorphic adenoma | 2 | 1 | 1 | ||
| Epithelial–myoepithelial carcinoma | 1 | 1 | |||
| Polymorphous low-grade adenocarcinoma | 1 | 1 | |||
| Lymphoepithelial carcinoma | 1 | 1 | |||
| Malignant lymphoma | 3 | 3 | |||
| Total | 98 | 46 | 14 | 3 | 35 |
MRI
MRI scans were conducted using a 1.5-T unit with a head and neck array coil. Pre-contrast T1 weighted spin echo images [repetition time (TR)/echo time (TE), 500–700/14 ms] and T2 weighted fast spin echo images (TR/TE, 3000–5000/90 ms; echo train length, 7) with fat suppression were obtained in axial and coronal planes, with 3–4 mm section thickness, 0.3–1.0 mm intersection gap, field of view (FOV) of 173 × 230 mm and pixel of 154 × 256. DCE-MRI was performed using a two dimensional-fast flow angle shot sequence (TR/TE, 30/4.1 ms; flip angle, 30°; 5-mm section thickness; FOV of 188 × 300 mm and pixel of 136 × 256). In all cases, gadodiamide hydrate (0.2 ml kg−1) was intravenously administered at a rate of 3 ml s−1 using a power injector, followed by a 20-ml saline flush. Scanning of the section with the maximum tumour diameter was initiated when the contrast injection was started. The scan time was 4.2 s, and MR images were sequentially obtained at 5-s intervals for 370 s. Namely, we applied the fast DCE-MRI technique with high temporal resolution. After DCE-MRI, post-contrast T1 weighted spin echo images (TR/TE, 500–700/14 ms) with fat suppression were obtained, with the parameters similar to those of the pre-contrast imaging.
Data analysis of dynamic contrast-enhanced MRI
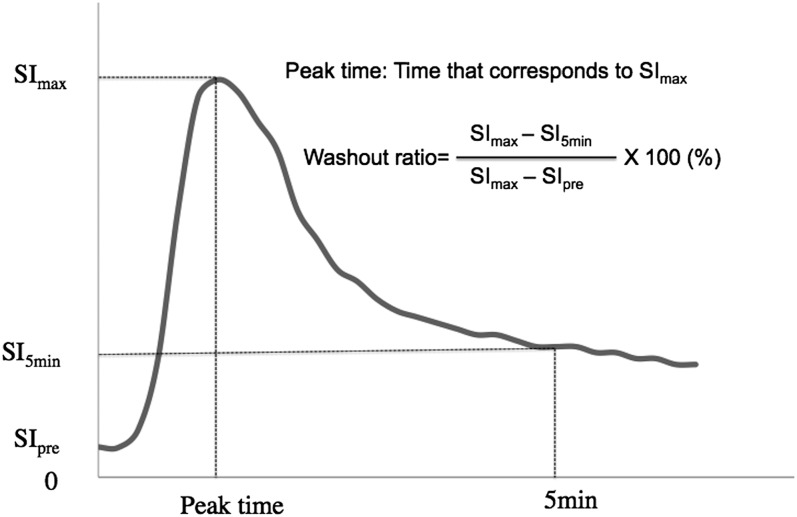
An author with 17 years' experience in MRI interpretation (TK), who was blinded to the histopathological results, manually drew a region of interest (ROI) for signal intensity measurement on DCE-MR images, in a manner similar to that of Yabuuchi et al.8,14 Specifically, when drawing a ROI, the vessels and cystic portions of the tumour were avoided. We plotted the mean signal intensity within the ROI against time and constructed a TIC as shown in Figure 1. In accordance with several previous studies,8–15,20 two parameters, peak time and WR, were determined from the TIC in each case. Peak time was defined as the duration corresponding to the maximum signal intensity (SImax), whereas WR was defined as follows: [(SImax − SI5min)/(SImax − SIpre)] × 100 (%). SIpre and SI5min were the signal intensities at times 0 and 5 min after contrast injection, respectively. Comparing TIC and the histopathological results, we determined the optimal thresholds of the two parameters for the differential diagnosis of salivary gland tumours. The accuracy of the diagnostic criteria defined by these thresholds was also evaluated.
Figure 1.
Time–signal intensity curve and the definitions of the two parameters, peak time and washout ratio. The horizontal and vertical lines represent the time after contrast material injection and tumour signal intensity, respectively. SI5min, signal intensity at 5 min; SImax, maximum signal intensity; SIpre, signal intensity at 0 min.
Evaluation of conventional MRI
The same author evaluated T1, T2 and post-contrast T1 weighted MR images of the 98 cases, which were presented separately from DCE-MR images, with attention to the presence or absence of MR findings suggestive of malignancy. Tumours showing ill-defined margins and/or infiltration into adjacent tissues were diagnosed as malignant, and the results of conventional MRI were compared with those of DCE-MRI.
Statistical analysis
The sensitivity, specificity, overall accuracy, and positive- and negative-predictive values were calculated to evaluate the diagnostic accuracy of DCE-MRI in predicting malignant salivary gland tumours.
RESULTS
Classification of time–signal intensity curves
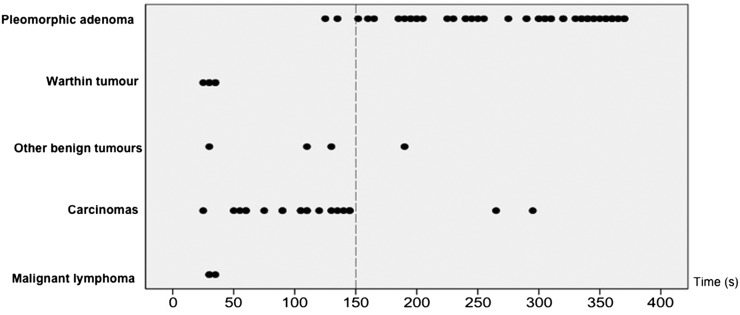
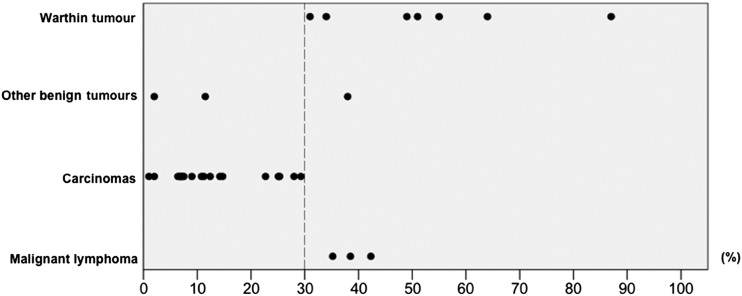
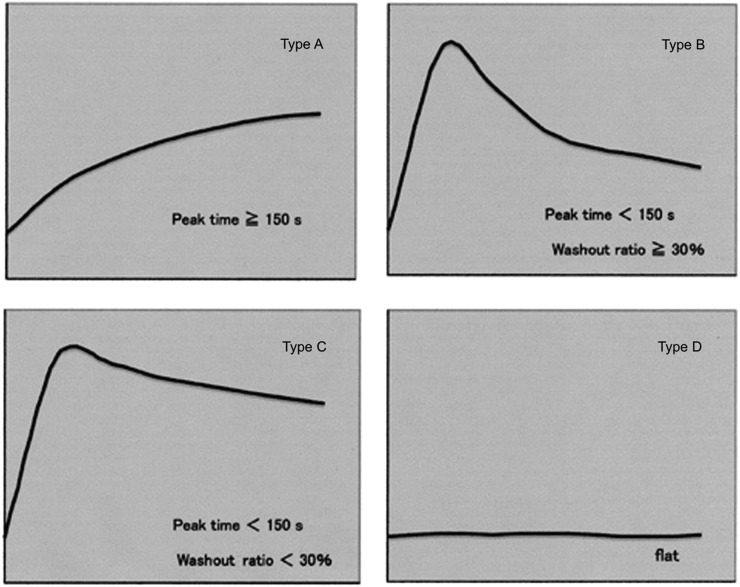
The distribution of peak times of all lesions, excluding 10 cases that showed no contrast enhancement, is shown in Figure 2. We considered peak time of 150 s to be the optimal threshold because it most accurately discriminated between pleomorphic adenoma and other tumours. Next, we evaluated the WRs of all tumours except pleomorphic adenoma. Pleomorphic adenomas were not included in this evaluation because they were mostly distinguishable from other tumours by peak time alone. As shown in Figure 3, the optimal WR threshold was considered to be 30%, as this value most accurately discriminated carcinomas from other tumours. Using these thresholds, we classified the TICs into the following four types: Type A, gradual enhancement with peak time ≥150 s; Type B, early enhancement and high washout with peak time <150 s and WR ≥30%; Type C, early enhancement and low washout with peak time <150 s and WR <30%; and Type D, flat (Figure 4).
Figure 2.
The distribution of peak times in salivary gland tumours. A peak time of 150 s (dotted line) is considered the optimal threshold because it most accurately discriminates between pleomorphic adenoma and other tumours.
Figure 3.
The distribution of washout ratios in salivary gland tumours. A washout ratio of 30% (dotted line) is considered the optimal threshold because it most accurately discriminates between carcinomas and other tumours.
Figure 4.
Type classification of the time–signal intensity curves. The time–signal intensity curves are classified into four patterns (Types A–D) based on the following thresholds: peak time of 150 s and washout ratio of 30%.
Differential diagnosis of salivary gland tumours by time–signal intensity curve
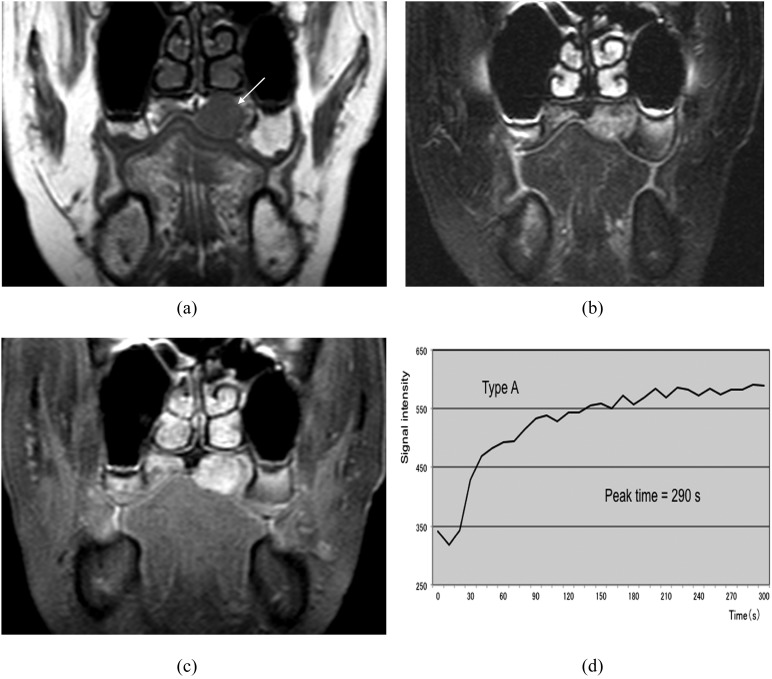
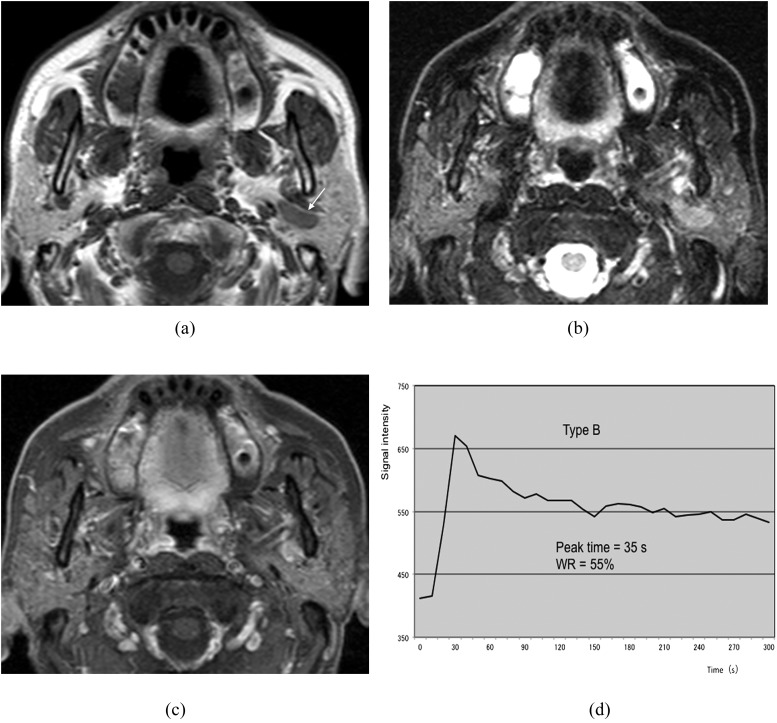
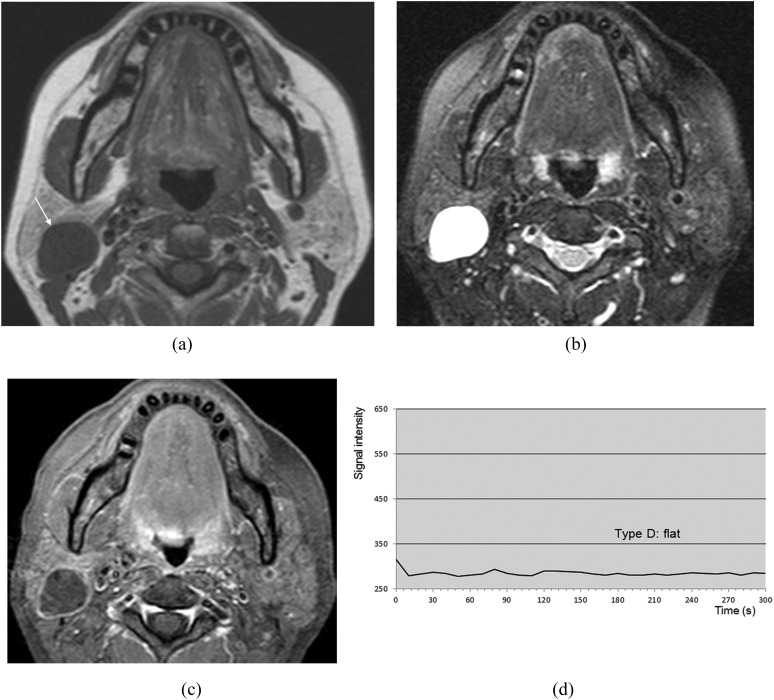
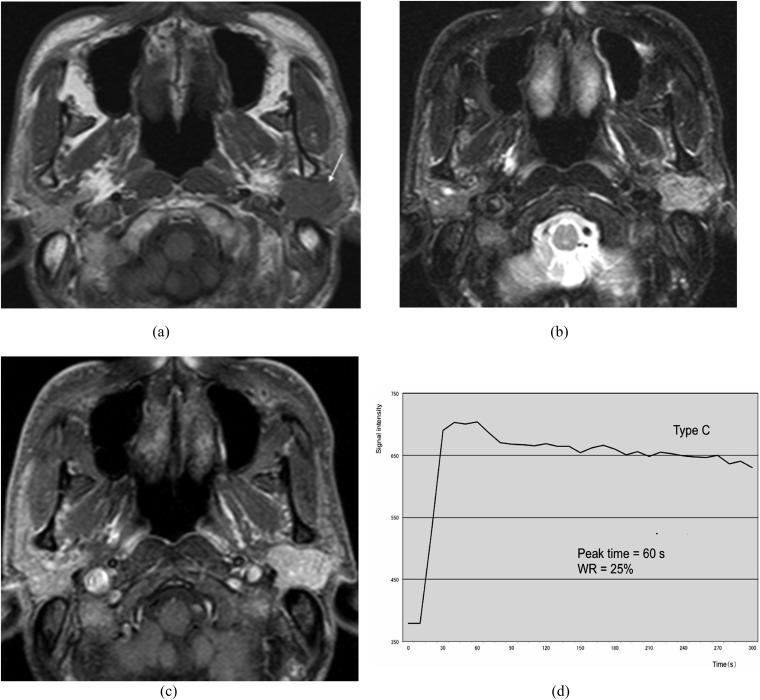
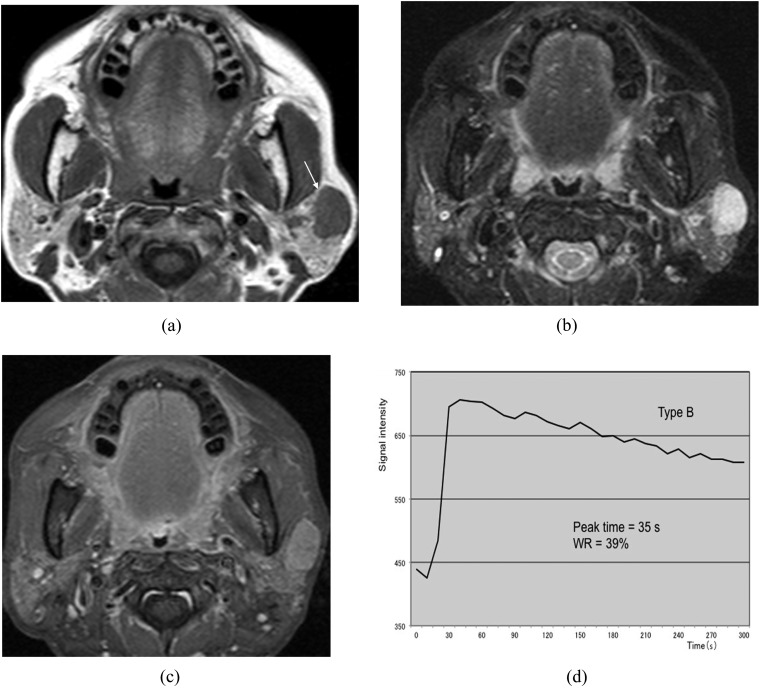
Table 2 shows the classification of the 98 salivary gland tumours based on TICs. All pleomorphic adenomas but 2 (51/53) showed Type A pattern (Figure 5), whereas Warthin tumours were either Type B (Figure 6) or Type D. Seven lymphoepithelial cysts were all Type D (Figure 7). All carcinomas but 2 (19/21) showed Type C pattern (Figure 8). By contrast, three malignant lymphomas were all Type B (Figure 9).
Table 2.
Classification of time–signal intensity curve (TIC) of the 98 salivary gland tumours (number of cases)
| Diagnosis | TIC types |
||||
|---|---|---|---|---|---|
| Type A | Type B | Type C | Type D | ||
| Benign | 74 | ||||
| Pleomorphic adenoma | 53 | 51 | 2 | ||
| Warthin tumour | 10 | 7 | 3 | ||
| Basal cell adenoma | 1 | 1 | |||
| Myoepithelioma | 3 | 1 | 2 | ||
| Lymphoepithelial cyst | 7 | 7 | |||
| Malignant | 24 | ||||
| Adenoid cystic carcinoma | 8 | 8 | |||
| Mucoepidermoid carcinoma | 5 | 5 | |||
| Adenocarcinoma | 3 | 3 | |||
| Carcinoma ex pleomorphic adenoma | 2 | 1 | 1 | ||
| Epithelial–myoepithelial carcinoma | 1 | 1 | |||
| Polymorphous low-grade adenocarcinoma | 1 | 1 | |||
| Lymphoepithelial carcinoma | 1 | 1 | |||
| Malignant lymphoma | 3 | 3 | |||
| Total | 98 | 54 | 11 | 23 | 10 |
Figure 5.
Pleomorphic adenoma in the left palate (50-year-old female). (a) T1 weighted image reveals a hypointense mass (arrow). (b) T2 weighted image with fat suppression reveals a mass with inhomogeneous high signal intensity. (c) Post-contrast T1 weighted image with fat suppression reveals slightly inhomogeneous tumour enhancement. (d) The time–signal intensity curve has Type A pattern (peak time of 290 s).
Figure 6.
Warthin tumour of the left parotid gland (69-year-old male). (a) T1 weighted image reveals a hypointense mass (arrow). (b) T2 weighted image with fat suppression reveals a mass with intermediate-to-high signal intensity. (c) Post-contrast T1 weighted image with fat suppression reveals slight tumour enhancement. (d) The time–signal intensity curve has Type B pattern [peak time of 35 s and washout ratio (WR) of 55%].
Figure 7.
Lymphoepithelial cyst of the right parotid gland (51-year-old female). (a) T1 weighted image reveals a hypointense mass (arrow). (b) T2 weighted image with fat suppression reveals a mass with homogeneous high signal intensity. (c) Post-contrast T1 weighted image with fat suppression reveals no enhancement of the mass except for the wall. (d) The time–signal intensity curve has Type D pattern.
Figure 8.
Epithelial–myoepithelial carcinoma of the left parotid gland (62-year-old female). (a) T1 weighted image reveals a hypointense mass with a well-defined border (arrow). (b) T2 weighted image with fat suppression reveals a mass with high signal intensity. (c) Post-contrast T1 weighted image with fat suppression reveals almost homogeneous tumour enhancement. (d) The time–signal intensity curve has Type C pattern [peak time of 60 s and washout ratio (WR) of 25%].
Figure 9.
Malignant lymphoma of the left parotid gland (62-year-old female). (a) T1 weighted image reveals a hypointense mass with a relatively well-defined border (arrow). (b) T2 weighted image with fat suppression reveals a mass with homogeneous high signal intensity. (c) Post-contrast T1 weighted image with fat suppression reveals almost homogeneous tumour enhancement. (d) The time–signal intensity curve has Type B pattern [peak time of 35 s and washout ratio (WR) of 39%].
When Type C pattern was used as the criterion for predicting malignancy, it provided a sensitivity of 79% (19/24), specificity of 95% (70/74) and an overall accuracy of 91% (89/98) (Table 3). Three out of the five false-negative results were malignant lymphomas of the parotid gland.
Table 3.
Diagnostic accuracy of dynamic contrast-enhanced MRI in predicting malignant salivary gland tumours
| Diagnostic accuracy | |
|---|---|
| Value | |
| Sensitivity | 79% (19/24) |
| Specificity | 95% (70/74) |
| Overall accuracy | 91% (89/98) |
| Positive-predictive value | 83% (19/23) |
| Negative-predictive value | 93% (70/75) |
Data in parentheses indicate the number of cases that were used to calculate the percentages.
Comparison of dynamic contrast-enhanced MRI with conventional MRI
Conventional MR images provided a sensitivity of 50% (12/24) and specificity of 97% (72/74). Out of 12 malignant tumours with false-negative results on conventional MRI, 7 were correctly reclassified on the basis of the above-mentioned criterion of DCE-MRI.
DISCUSSION
Several conventional MRI findings suggestive of malignancy in salivary gland tumours have been reported. These include ill-defined margins, infiltration into adjacent tissues and low signal intensity on T2 weighted images.5,7,17,21,22 However, this modality results in considerable overlap between benign and malignant tumours in terms of imaging appearance.3 Christe et al22 recently reported that the sensitivity and the specificity of the above-mentioned MRI findings in predicting malignancy were 70% and 73%, respectively. As a result, the validity of conventional MRI in the differential diagnosis of salivary gland tumours is considered to be limited.
Several studies have recently reported the usefulness of TIC obtained via DCE-MRI in differentiating malignant from benign salivary gland tumours. In these reports, malignant tumours were characterized by early enhancement and low washout, whereas benign pleomorphic adenomas demonstrated gradual enhancement, and Warthin tumours exhibited early enhancement and high washout.8–15 However, the definitions and thresholds of peak time and WR, which were used to classify TICs into such patterns, differed considerably among the studies. Specifically, whereas peak time was most commonly defined as the time required to reach maximum tumour enhancement after contrast material administration, Yabuuchi et al8,14 defined it as the time required to reach 90% of maximum tumour enhancement. The threshold of peak time that discriminated between malignant tumours and pleomorphic adenomas also varied among the studies and included 120,8,13–15 16520 and 210 s.12 Furthermore, the definition of WR, which represents the degree of signal intensity decline at a certain time point after contrast material administration, also differed among the studies. Although some studies defined WR at 5 min after contrast administration,8,12,14,20 others defined it at 3–4 min.9–11,13,15 The WR thresholds reported in past studies include 10%,12 20%,15 30%8–11,13,14 and 40%.12
As mentioned above, the efficacy of DCE-MRI in differentiating malignant from benign salivary gland tumours has not yet been fully established. One of the reasons for the inconsistencies among past studies might be their small sample sizes; with one exception,6 each analysed only 20–50 cases.8–15,17–20 Another reason may be the differences in imaging protocols used to obtain DCE-MRI data sets. For obtaining accurate TICs, dynamic sequences with high temporal resolutions should be applied.6,16 Furthermore, evaluating differences in WR among different types of tumours requires a sufficiently long total scan time.16 However, in most of the past studies on DCE-MRI of salivary gland tumours, the interval between sequential MR images ranged from 15 to 60 s.8–12,14,17–20 Although this duration was 10 s in a few studies,6,13,15 which, to our knowledge, was the shortest interval employed, the total scan time in these studies was quite short, at 1006 or 180 s.13,15 By contrast, we applied fast DCE-MRI with high temporal resolution and sufficient examination time to 98 cases with salivary gland tumours. Specifically, MR images were sequentially obtained at 5-s intervals for 370 s. Furthermore, in all cases, contrast material was administered at a rate of 3 ml s−1 using a power injector, followed by a 20-ml saline flush. Use of a power injector would be expected to reduce or eliminate the potential variability in injection rate that occurs during manual administration of contrast material.
As shown in Figures 2 and 3, the optimal threshold of peak time defined in this study, 150 s, most accurately discriminated between malignant tumours and pleomorphic adenomas. Furthermore, the optimal threshold of WR at 5 min was 30%, and this most accurately discriminated between malignant and Warthin tumours. Using these thresholds, we defined Type C pattern, with early enhancement with low washout, as having peak time of <150 s and WR of <30%. When Type C pattern was used as the criterion for malignancy, it provided a sensitivity of 79% (19/24), specificity of 95% (70/74) and overall accuracy of 91% (89/98). In the study by Yabuuchi et al,14 in which the images were obtained at 30-s intervals, the sensitivity, specificity and overall accuracy of DCE-MRI were 71% (10/14), 86% (31/36) and 82% (41/50), respectively. Thus, the diagnostic accuracy in our study using fast DCE-MRI might be slightly higher than that in their study. In our series, we found that peak times in some cases of carcinomas and pleomorphic adenomas were distributed around the threshold of 150 s (Figure 2). Similarly, WRs in some cases of carcinomas and Warthin tumours were distributed around the threshold of 30% (Figure 3). These cases might have been misclassified if we did not apply fast DCE-MRI with a temporal resolution of 5 s. Thus, we believe that the use of a dynamic sequence with high temporal resolution will improve the diagnostic accuracy of DCE-MRI in the differential diagnosis of salivary gland tumours.
In our series, all but 2 of the 21 carcinomas showed Type C pattern (the exceptions were carcinoma ex pleomorphic adenoma and polymorphous low-grade adenocarcinoma). On the other hand, three malignant lymphomas all were Type B, with early enhancement and high washout, and none was Type C. Thus, malignant lymphomas accounted for three of five false-negative cases. All these occurred in the parotid gland, and histopathologically were diffuse large B-cell lymphoma (one case) and mucosa-associated lymphoid tissue lymphomas (two cases). Concerning the TIC parameters, it was previously reported that WR reflected tumour cellularity, whereas peak time correlated with vascularity.8,13 This is probably because tumours with a large extracellular space and fibrous stroma can retain contrast material for a period of time, while tumours with high cellularity-stromal grades, including Warthin tumours, will retain less contrast material and have a high WR.8 Histopathologically, malignant lymphoma is known to have more cellularity and less extracellular space than do head and neck carcinomas23,24 and is considered to primarily exhibit Type B pattern. Asaumi et al,25 reported that 14 out of 17 head and neck lymphomas showed early enhancement and high washout on TIC. Similar results were also reported by other studies.13,15 Thus, we consider that it may be impossible to differentiate between malignant lymphomas of the parotid gland and Warthin tumours by DCE-MRI alone.
It is an important concern to compare the diagnostic accuracy of DCE-MRI with that of other diagnostic modalities. Fine-needle aspiration cytology (FNAC) is a widely recommended modality for characterization of salivary gland tumours, although it is not routinely applied in Tokyo Medical and Dental University Dental Hospital. The accuracy of FNAC is dependent on availability of expertise and is known to be quite high when it is performed by experienced clinicians and pathologists.4,7,26 Namely, Inohara et al7 reported that the sensitivity, specificity and accuracy of FNAC in detecting salivary gland malignancy were 90%, 95% and 94%, respectively. Kraft et al26 evaluated the combination of FNAC and ultrasonography and reported that it provided the sensitivity of 100% and accuracy of 99%. Although DCE-MRI could correctly reclassify 7 out of 12 malignant tumours with false-negative results by conventional MRI in our study, it should not be considered as an alternative to FNAC.
There are some limitations to our study. First, we did not perform multisection dynamic MRI and scanned only the sections showing the maximum tumour diameters. Thus, for tumours with heterogeneous internal structures, it is possible that other sections showed a different TIC pattern. Second, although our study included 98 cases, a relatively large number, malignant tumours comprised only 25% of these (24 cases), whereas pleomorphic adenomas comprised >50% (53 cases). Thus, the composition of our study population may have affected the results.
In conclusion, our study revealed that a peak time of 150 s and a WR of 30% were the most suitable thresholds for TIC obtained by DCE-MRI of salivary gland tumours. When the pattern of early enhancement with low washout (peak time <150 s and WR <30%) was used as the criterion for malignancy, DCE-MRI provided a sensitivity of 79%, specificity of 95% and an overall accuracy of 91%. A dynamic sequence with high temporal resolution might improve the diagnostic accuracy of DCE-MRI, although its usefulness in differentiating malignant lymphoma from Warthin tumour is considered limited.
Contributor Information
P D Lam, Email: dr.lamdaiphong@gmail.com.
A Kuribayashi, Email: ami8orad@tmd.ac.jp.
A Imaizumi, Email: aimaizumi@tdc.ac.jp.
J Sakamoto, Email: sakajun.orad@tmd.ac.jp.
Y Sumi, Email: yasusumi@ncgg.go.jp.
N Yoshino, Email: norio.orad@tmd.ac.jp.
T Kurabayashi, Email: kura.orad@tmd.ac.jp.
REFERENCES
- 1.Batsakis JG, ed. Tumors of the head and neck. 2nd edn. Baltimore, MD: Williams & Wilkins; 1979. [Google Scholar]
- 2.Eveson JW, Auclair P, Gnepp DR, EL-Naggar AK. Tumours of the salivary gland. In: Barnes L, Eveson JW, Reichart P, Sidransky D, eds. Pathology and genetics of head and neck tumours. Lyon, France: IARC Press; 2005. pp. 210–81. [Google Scholar]
- 3.Thoeny HC. Imaging of salivary gland tumours. Cancer Imaging 2007; 7: 52–62. doi: 10.1102/1470-7330.2007.0008 [DOI] [PMC free article] [PubMed] [Google Scholar]
- 4.Lee YY, Wong KT, King AD, Ahuja AT. Imaging of salivary gland tumours. Eur J Radiol 2008; 66: 419–36. doi: 10.1016/j.ejrad.2008.01.027 [DOI] [PubMed] [Google Scholar]
- 5.Freling NJ, Molenaar WM, Vermey A, Mooyaart EL, Panders AK, Annyas AA, et al. Malignant parotid tumors: clinical use of MR imaging and histologic correlation. Radiology 1992; 185: 691–6. [DOI] [PubMed] [Google Scholar]
- 6.Alibek S, Zenk J, Bozzato A, Lell M, Grunewald M, Anders K, et al. The value of dynamic MRI studies in parotid tumors. Acad Radiol 2007; 14: 701–10. doi: 10.1016/j.acra.2007.03.004 [DOI] [PubMed] [Google Scholar]
- 7.Inohara H, Akahani S, Yamamoto Y, Hattori K, Tomiyama Y, Tomita Y, et al. The role of fine-needle aspiration cytology and magnetic resonance imaging in the management of parotid mass lesions. Acta Otolaryngol 2008; 128: 1152–8. doi: 10.1080/00016480701827533 [DOI] [PubMed] [Google Scholar]
- 8.Yabuuchi H, Fukuya T, Tajima T, Hachitada Y, Tomita K, Koga M. Salivary gland tumors: diagnostic value of gadolinium-enhanced dynamic MR imaging with histopathologic correlation. Radiology 2003; 226: 345–54. doi: 10.1148/radiol.2262011486 [DOI] [PubMed] [Google Scholar]
- 9.Motoori K, Yamamoto S, Ueda T, Nakano K, Muto T, Nagai Y, et al. Inter- and intratumoral variability in magnetic resonance imaging of pleomorphic adenoma: an attempt to interpret the variable magnetic resonance findings. J Comput Assist Tomogr 2004; 28: 233–46. doi: 10.1097/00004728-200403000-00014 [DOI] [PubMed] [Google Scholar]
- 10.Ikeda M, Motoori K, Hanazawa T, Nagai Y, Yamamoto S, Ueda T, et al. Warthin tumor of the parotid gland: diagnostic value of MR imaging with histopathologic correlation. AJNR Am J Neuroradiol 2004; 25: 1256–62. [PMC free article] [PubMed] [Google Scholar]
- 11.Motoori K, Ueda T, Uchida Y, Chazono H, Suzuki H, Ito H. Identification of Warthin tumor: magnetic resonance imaging versus salivary scintigraphy with technetium-99m pertechnetate. J Comput Assist Tomogr 2005; 29: 506–12. doi: 10.1097/01.rct.0000164672.34261.33 [DOI] [PubMed] [Google Scholar]
- 12.Hisatomi M, Asaumi J, Yanagi Y, Unetsubo T, Maki Y, Murakami J, et al. Diagnostic value of dynamic contrast-enhanced MRI in the salivary gland tumors. Oral Oncol 2007; 43: 940–7. doi: 10.1016/j.oraloncology.2006.11.009 [DOI] [PubMed] [Google Scholar]
- 13.Eida S, Ohki M, Sumi M, Yamada T, Nakamura T. MR factor analysis: improved technology for the assessment of 2D dynamic structures of benign and malignant salivary gland tumors. J Magn Reson Imaging 2008; 27: 1256–62. doi: 10.1002/jmri.21349 [DOI] [PubMed] [Google Scholar]
- 14.Yabuuchi H, Matsuo Y, Kamitani T, Setoguchi T, Okafuji T, Soeda H, et al. Parotid gland tumors: can addition of diffusion-weighted MR imaging to dynamic contrast-enhanced MR imaging improve diagnostic accuracy in characterization? Radiology 2008; 249: 909–16. doi: 10.1148/radiol.2493072045 [DOI] [PubMed] [Google Scholar]
- 15.Sumi M, Nakamura T. Head and neck tumours: combined MRI assessment based on IVIM and TIC analyses for the differentiation of tumors of different histological types. Eur Radiol 2014; 24: 223–31. doi: 10.1007/s00330-013-3002-z [DOI] [PubMed] [Google Scholar]
- 16.Furukawa M, Parvathaneni U, Maravilla K, Richards TL, Anzai Y. Dynamic contrast-enhanced MR perfusion imaging of head and neck tumors at 3 Tesla. Head Neck 2013; 35: 923–9. doi: 10.1002/hed.23051 [DOI] [PubMed] [Google Scholar]
- 17.Takashima S, Noguchi Y, Okumura T, Aruga H, Kobayashi T. Dynamic MR imaging in the head and neck. Radiology 1993; 189: 813–21. doi: 10.1148/radiology.189.3.8234709 [DOI] [PubMed] [Google Scholar]
- 18.Tsushima Y, Matsumoto M, Endo K. Parotid and parapharyngeal tumours: tissue characterization with dynamic magnetic resonance imaging. Br J Radiol 1994; 67: 342–5. doi: 10.1259/0007-1285-67-796-342 [DOI] [PubMed] [Google Scholar]
- 19.Suenaga S, Indo H, Noikura T. Diagnostic value of dynamic magnetic resonance imaging for salivary gland diseases: a preliminary study. Dentomaxillofac Radiol 2001; 30: 314–18. doi: 10.1038/sj/dmfr/4600634 [DOI] [PubMed] [Google Scholar]
- 20.Matsuzaki H, Yanagi Y, Hara M, Katase N, Hisatomi M, Uetsubo T, et al. Diagnostic value of dynamic contrast-enhanced MRI for submucosal palatal tumors. Eur J Radiol 2012; 81: 3306–12. doi: 10.1016/j.ejrad.2012.04.009 [DOI] [PubMed] [Google Scholar]
- 21.Som PM, Biller HF. High-grade malignancies of the parotid gland: identification with MR imaging. Radiology 1989; 173: 823–6. doi: 10.1148/radiology.173.3.2813793 [DOI] [PubMed] [Google Scholar]
- 22.Christe A, Waldherr C, Hallet R, Zbaeren P, Thoeny H. MR imaging of parotid tumors: typical lesion characteristics in MR imaging improve discrimination between benign and malignant disease. AJNR Am J Neuroradiol 2011; 32: 1202–7. doi: 10.3174/ajnr.A2520 [DOI] [PMC free article] [PubMed] [Google Scholar]
- 23.Wang J, Takashima S, Takayama F, Kawakami S, Saito A, Matsushita T, et al. Head and neck lesions: characterization with diffusion-weighted echo-planar MR imaging. Radiology 2001; 220: 621–30. doi: 10.1148/radiol.2202010063 [DOI] [PubMed] [Google Scholar]
- 24.Sumi M, Ichikawa Y, Nakamura T. Diagnostic ability of apparent diffusion coefficients for lymphomas and carcinomas in the pharynx. Eur Radiol 2007; 17: 2631–7. doi: 10.1007/s00330-007-0588-z [DOI] [PubMed] [Google Scholar]
- 25.Asaumi J, Yanagi Y, Hisatomi M, Matsuzaki H, Konouchi H, Kishi K. The value of dynamic contrast-enhanced MRI in diagnosis of malignant lymphoma of the head and neck. Eur J Radiol 2003; 48: 183–7. doi: 10.1016/S0720-048X(02)00347-9 [DOI] [PubMed] [Google Scholar]
- 26.Kraft M, Lang F, Mihaescu A, Wolfensberger M. Evaluation of clinician-operated sonography and fine-needle aspiration in the assessment of salivary gland tumors. Clin Otolaryngol 2008; 33: 18–24. doi: 10.1111/j.1749-4486.2007.01598.x [DOI] [PubMed] [Google Scholar]


