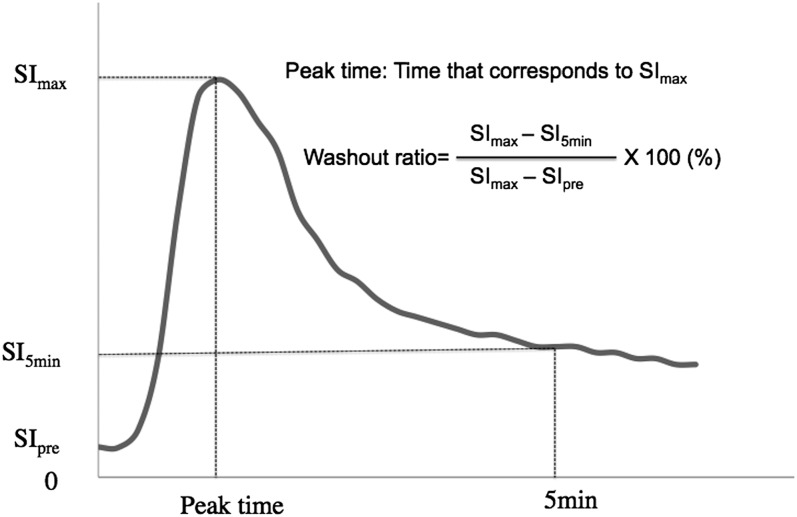
Figure 1.
Time–signal intensity curve and the definitions of the two parameters, peak time and washout ratio. The horizontal and vertical lines represent the time after contrast material injection and tumour signal intensity, respectively. SI5min, signal intensity at 5 min; SImax, maximum signal intensity; SIpre, signal intensity at 0 min.

