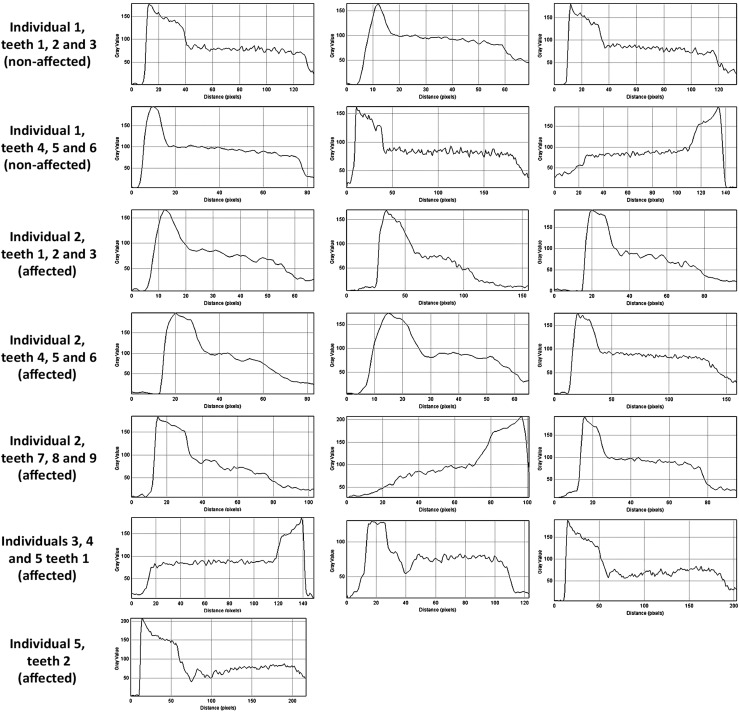
Figure 2.
Histograms expressing mineralization patterns as greyscale–distance plot profiles along the line bisecting teeth of affected and non-affected individuals. Each histogram expresses mineralization patterns from enamel to pulp for: individual 1 (teeth 1–5), individual 2 (teeth 1–7 and tooth 9), individual 4 (tooth 1) and individual 5 (teeth 1–2). Mineralization patterns are expressed from pulp to enamel for: individual 1 (tooth 6), individual 2 (tooth 8) and individual 3 (tooth 1).

