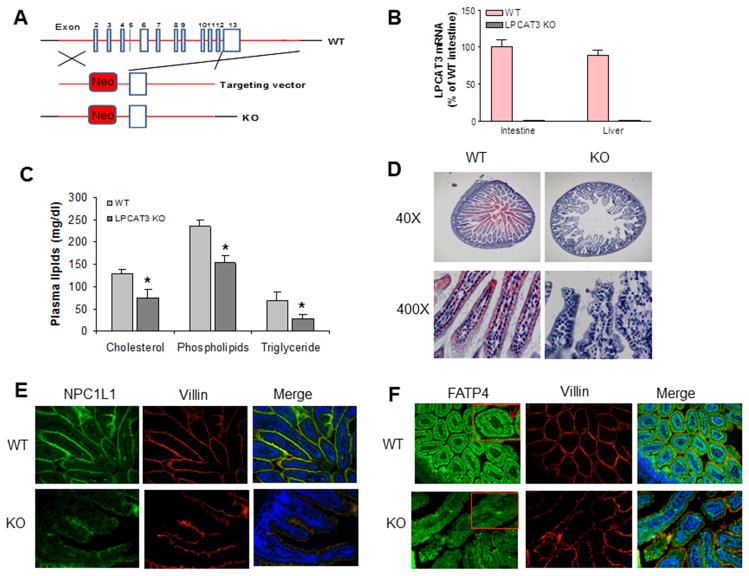
Figure 1. Generation and characterization of LPCAT3 KO mouse.
(A) Strategy used to disrupt mouse Lpcat 3 gene. (B) LPCAT3 mRNA in small intestine and liver from 2-weeks-old WT and LPCAT3 KO mice. (C) Total cholesterol, phospholipid, and triglyceride levels in the plasma from 10-days-old WT and LPCAT3 KO mice. (D) Small intestine Oil Red O staining from 10-days old mice. (E) Small intestine NPC1L1 immunofluorescence staining from 10-days-old mice. (F), Small intestine FATP4 immunofluorescence staining from 10-days-old mice. FATP4 signal was indicated by red arrows. Values are mean ± SD, n = 5, *P < 0.05.

