
Figure 6. Western blot of ABCA1, SR-BI, and MTP in liver homogenates, as well as lipoprotein production in vivo.
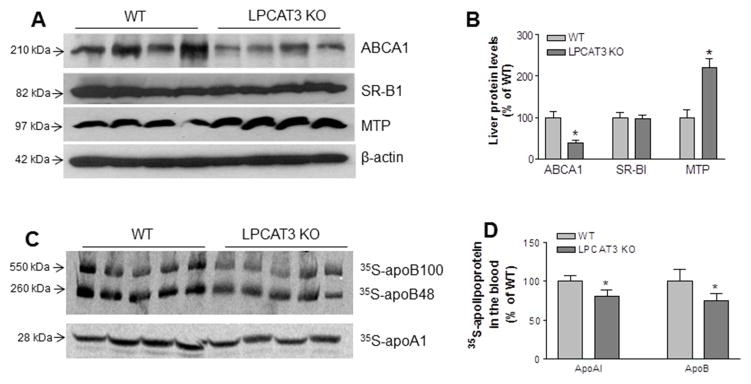
(A) Fluorogram of liver ABCA1, SR-BI, MTP, and β-actin (loading control). (B) Quantitation of ABCA1, SR-BI, and MTP in the liver. (C) In vivo VLDL and HDL production measurement. Fluorogram of plasma 35S-apoB and 35S-apoA-I on VLDL and HDL, respectively. (D) Quantitation of 35S-apoB and 35S-apoA-I in blood. Values are mean ± SD, n = 4–5, *P < 0.05.