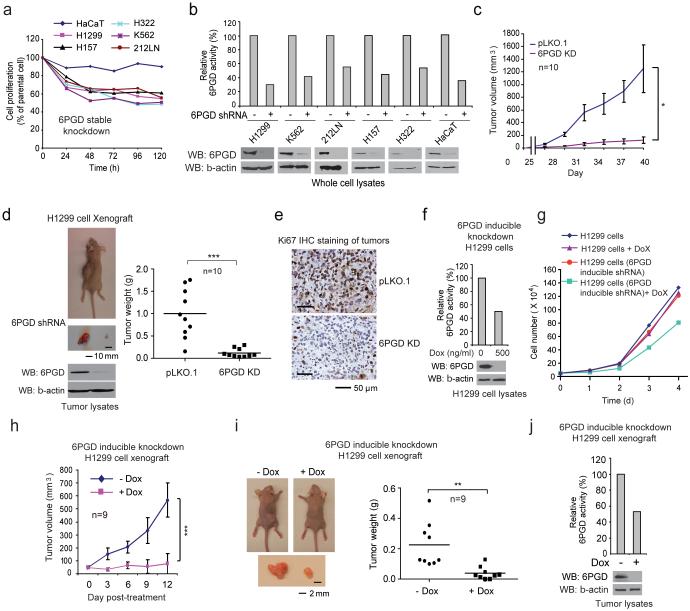
Fig. 1.
6PGD is important for cancer cell proliferation and tumor growth. (a-b) Cell proliferation rates determined by cell counting (a) and 6PGD activity (b; upper) in diverse human cancer cells with 6PGD stable knockdown (b; lower), which were normalized to the corresponding control vector cells. Keratinocyte HaCaT cells were included as controls. (c) Tumor growth was compared between xenograft nude mice injected with 6PGD KD H1299 cells and control vector cells. (d) Left: Dissected tumors in a representative nude mouse are shown. Scale bar represents 10 mm. Right: Tumor mass in xenograft nude mice injected with 6PGD KD H1299 cells compared to mice injected with the control vector cells. (e) Representative images of IHC staining of Ki-67 from xenograft mice injected with control vector or 6PGD KD H1299 cells. Scale bars indicate 50 μM. (f) 6PGD activity (upper) and protein expression (lower) in H1299 cells with inducible knockdown of 6PGD in the presence and absence of doxycycline (Dox). (g) Cell proliferation rates determined by cell counting in H1299 cells with inducible 6PGD knockdown and control cells in the presence and absence of Dox. (h) Tumor growth was compared between xenograft mice injected with H1299 cells with inducible 6PGD knockdown fed with drinking water in the presence or absence of Dox. (i-j) Dissected tumors in two representative nude mice (i; left) and tumor mass of xenograft mice injected with H1299 cells with inducible 6PGD knockdown (i; right) fed with drinking water in the presence or absence of Dox are shown. Scale bars represent 2 mm. 6PGD activity (upper) and protein expression (lower) in tumor lysates are shown (j). (a-g, and j) Data are from a single experiment that is representative of 2 independent experiments for (a) and 3 independent experiments for (b-g, and j). Source data for independently repeated experiments are provided in Supplementary Table 1. (c) Mean ± S.E.M.; n=10 tumors from 10 mice, (d) n=10 tumors from 10 mice; centerlines represent means, (h) Mean ± S.E.M.; n=9 tumors from 9 mice, (i) n=9 tumors from 9 mice; centerlines represent means. The P values were determined by two-sided unpaired Student’s t-test for (c, h, and i) and paired two-sided Student’s t-test for (d) (*: 0.01<p<0.05; **: 0.001<p<0.01; ***: p<0.001). (a-g, j). Source data for independent replications and experiments with sample size<5 are available in Supplementary Table 1. Uncropped Western blots are provided in Supplementary Figure 9.

