
Figure 4.
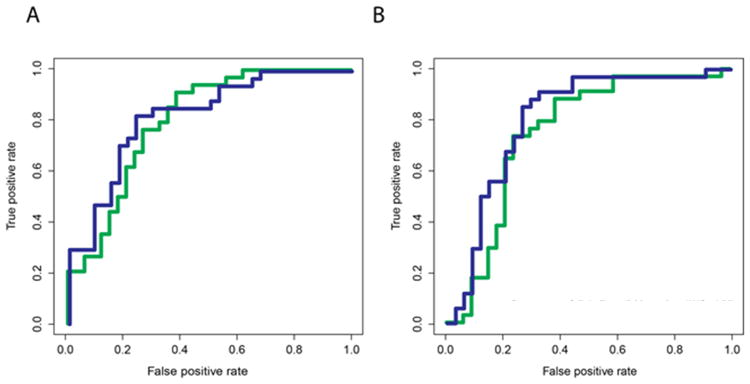
Receiver-operator characteristic curves for Random Forest models trained on Cohort 1 (A) or Cohort 2 (B) and validated on Cohort 3. Green curve: diagnostic performance of commonly available biomarkers (ANC, ESR, concentration of A1AT, CRP, and fibrinogen, and platelet count) (AUC 0.80 for Cohort 1 and AUC 0.83 for Cohort 2); Blue curve: diagnostic performance of commonly available biomarkers plus ALT and GGT (AUC 0.75 for Cohort 1 and 0.81 for Cohort 2).