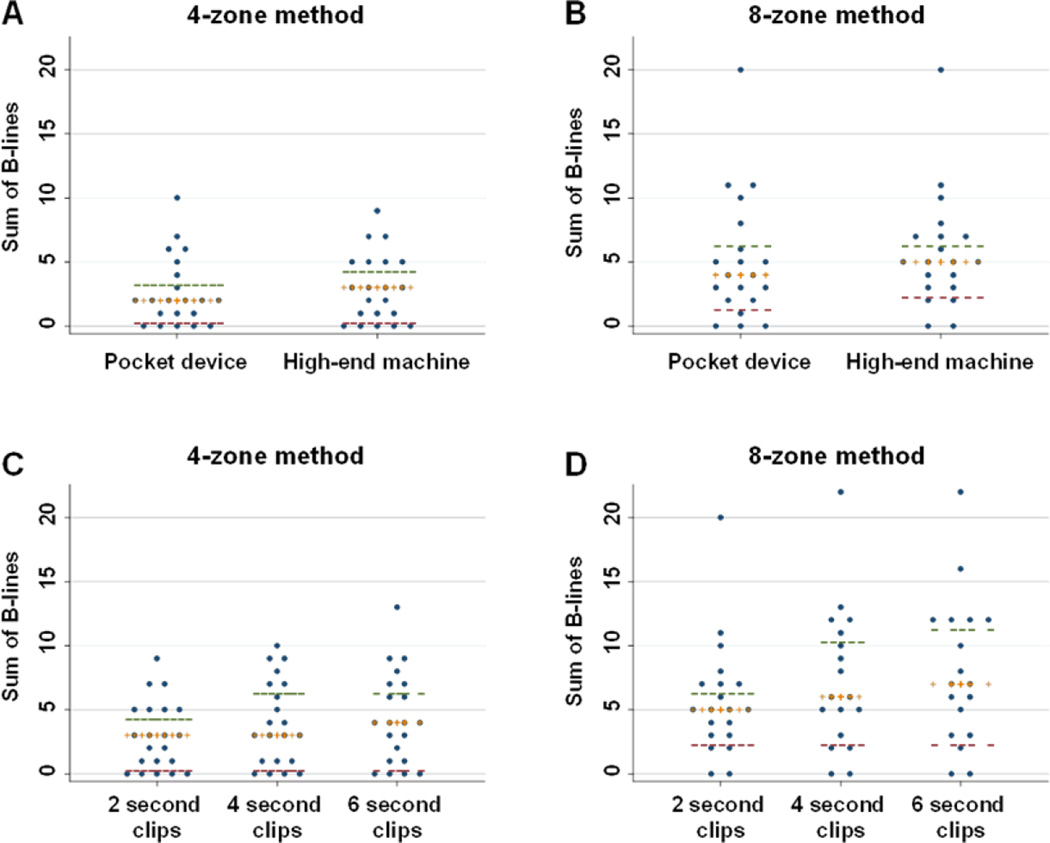
Figure 3.
The sum of detected B-lines are shown for the same patients scanned with the 4-zone and 8-zone method using the pocket device versus high-end machine (Panels A and B), and using clips of varying duration (Panels C and D). Cross bars represent medians, and horizontal dashes represent upper and lower interquartile range values.

