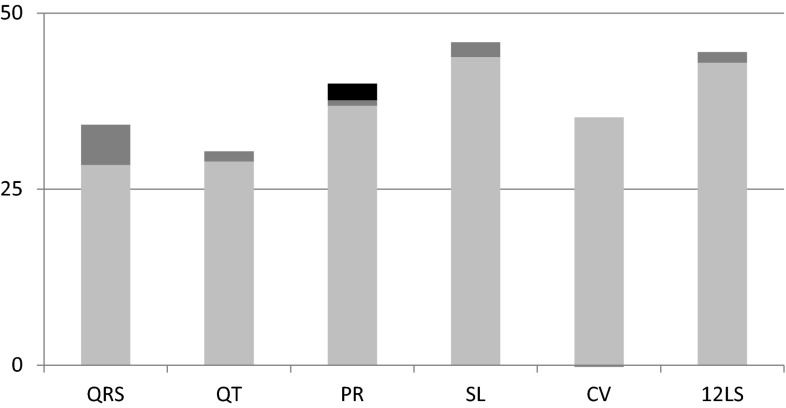
Fig. 1.
Heritability (h 2) of ECG measurements. The height of the bar indicates trait heritability. The proportion of unexplained heritability is in light gray and the proportion of heritability explained by trait-specific SNPs is depicted in dark gray. The additional proportion of the explained heritability of PR due to the inclusion of all ECG GWAS SNPs is in black

