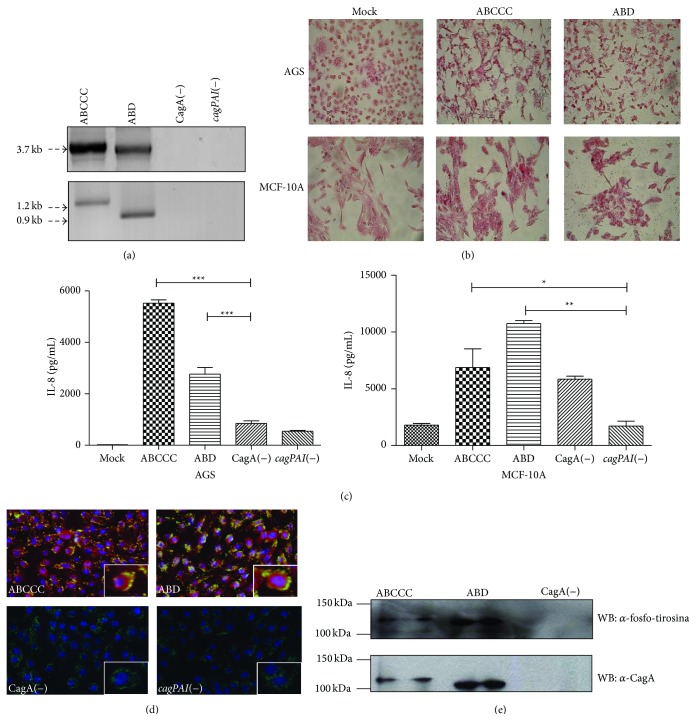
Figure 1.
CagA is translocated into MCF-10A cells. (a) PCR amplification of the C-terminal variable region. (b) Morphology of AGS and MCF-10A cells infected with CagA positive strains. (c) IL-8 determination in supernatants of infected cells. (d) Immunofluorescence image showing H. pylori (green), CagA (red), and nuclei (Blue). Inbox is an optical zoom of an infected cell. (e) Whole lysates from infected MCF-10A cell were immunoprecipitated with anti-CagA antibodies and immunoblotted against total phosphotyrosine proteins (top panel). The blots were reprobed with anti-CagA and anti-β-actin antibodies. Statistical analysis by one-way ANOVA followed by the Tukey test (* p ≤ 0.05, ** p ≤ 0.01 and *** p ≤ 0.001).

