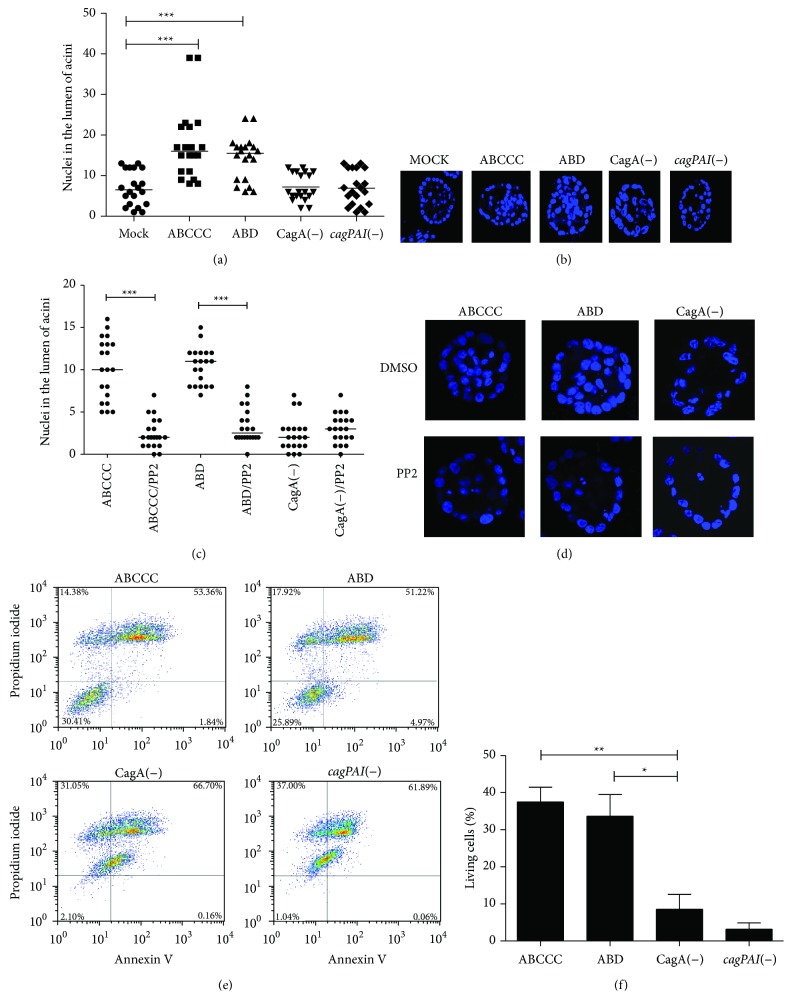
Figure 3.
CagA induces evasion of apoptosis. (a) The nuclei (DAPI positive cells) in the lumen of acini were quantified on day 10. Each point represents one acini; three fields were counted in three independent experiments. (b) Representative acini showing the typical number of nuclei positive cells in lumens. (c) The same experiment was carried out in the presence of the Src kinase inhibitor PP2. (d) Representative acini showing the typical number of nuclei positive cells in lumens after PP2 treatment. (e) MCF-10A cells were infected in suspension with H. pylori strains and apoptosis was determined by anexin V and propidium iodide (PI) staining. (f) Average percentage of living cell (Anexin V & PI negative) from three independent experiments. Asterisks denote statistical differences (* p ≤ 0.05, ** p ≤ 0.01, and *** p ≤ 0.001). (a) and (f) One-way ANOVA followed by the Tukey test, and (c) Student's t-test.

