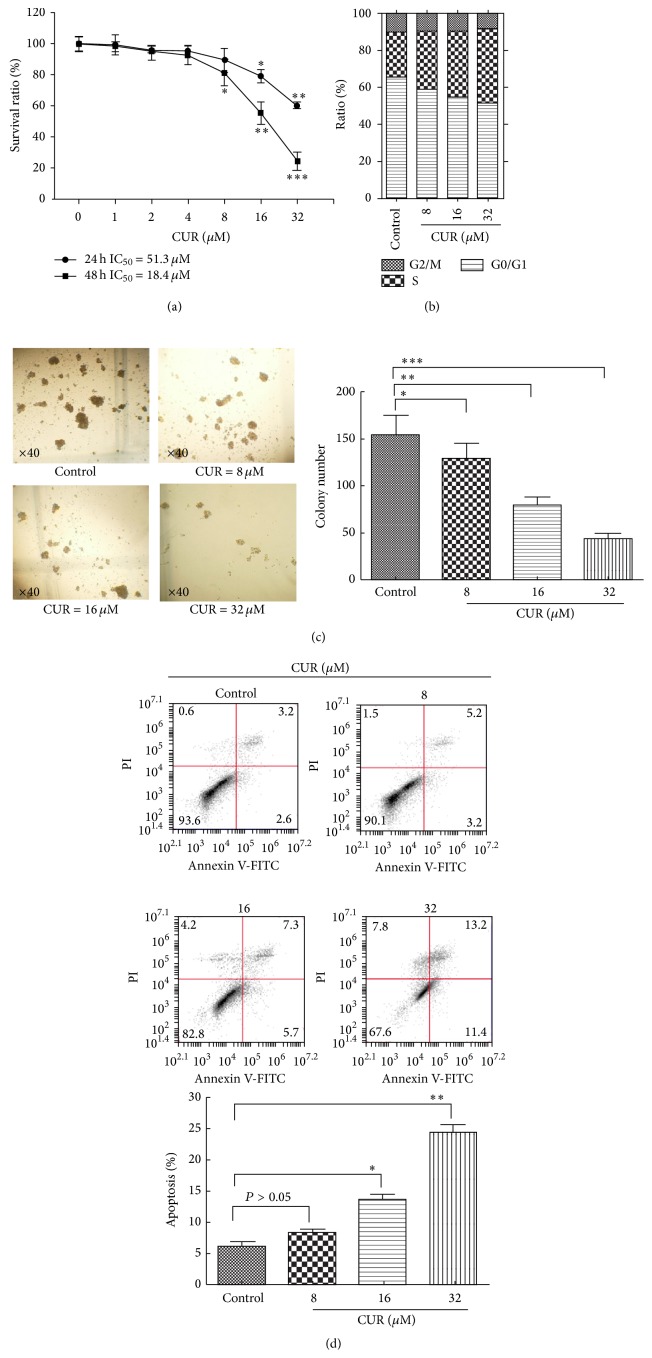
Figure 2.
CUR suppressed cell growth, induced S phase arrest, and induced cell apoptosis in KG1a cells. (a) KG1a cells were treated with different concentrations of CUR for 24 or 48 h. MTT assays were performed. (b) KG1a cells were treated with different concentrations of CUR for 48 h and analyzed for DNA content by flow cytometry. (c) KG1a cells were treated with CUR and inoculated in methylcellulose for 14 days and then observed under a right microscope (magnification ×40). The graph displays means ± SD of three independent experiments. ∗ P < 0.05, ∗∗ P < 0.01, and ∗∗∗ P < 0.001 (compared with control). (d) KG1a cells were treated with different concentrations of CUR for 48 h and analyzed by flow cytometry. The graph displays means ± SD of three independent experiments. ∗ P < 0.05, ∗∗ P < 0.01 (compared with control).

