Figure 4.
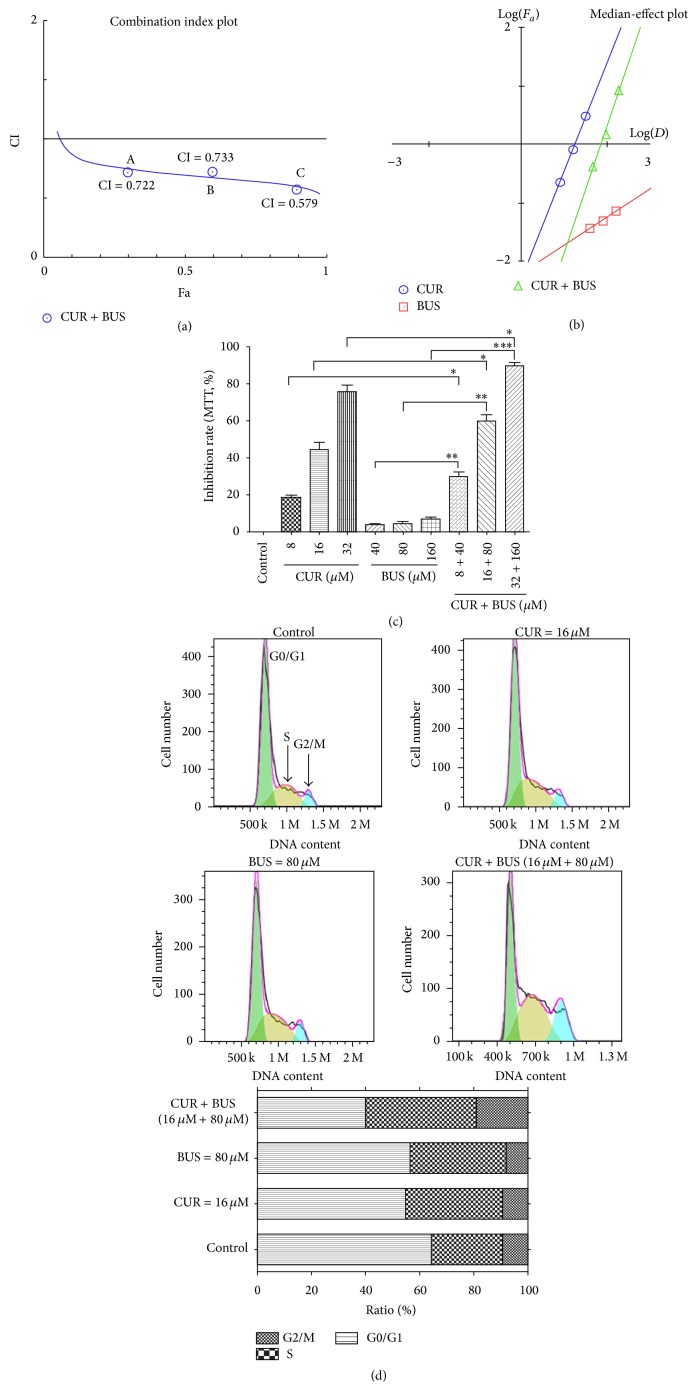
CUR synergistically enhanced the cytotoxic effect of BUS in KG1a cells. KG1a cells were exposed to CUR + BUS at different doses but in a constant ratio (CUR to BUS: 8 μM to 80 μM, 16 μM to 160 μM, and 32 μM to 320 μM, resp.) for 48 h examined by MTT assay. (a, b) CI-effect plots and median-effect plots were generated using Compusyn software. The points A, B, and C represent CI values for the three combination groups, respectively. (c) The graph displays means ± SD of three independent experiments. ∗ P < 0.05, ∗∗ P < 0.01, and ∗∗∗ P < 0.001. (d) KG1a cells were treated with CUR or BUS alone or CUR + BUS for 48 h and analyzed with flow cytometry. The percentages of cells in S and G2/M phases were significantly higher in CUR + BUS group compared with the CUR- or BUS-alone group.

