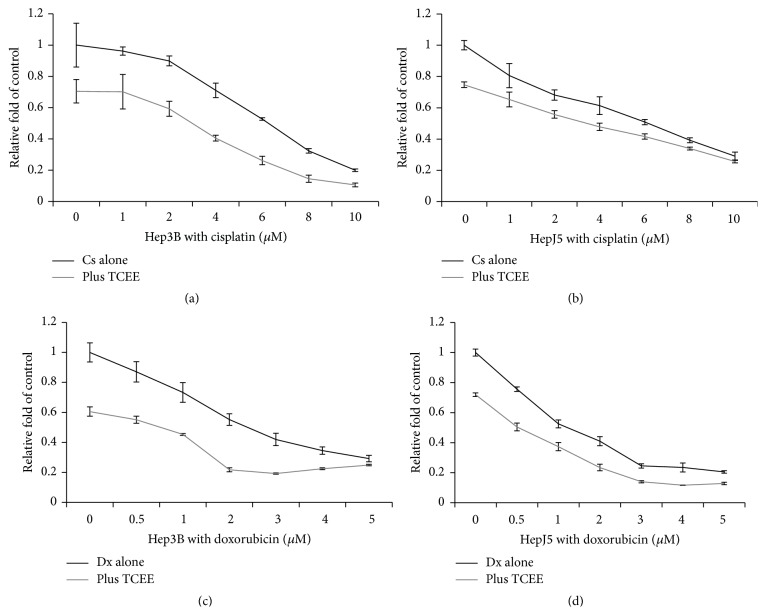
Figure 3.
The cell growth inhibition of cisplatin or doxorubicin with TCEE treatment on Hep3B and HepJ5 cells. Hep3B and HepJ5 cells were treated with 0 to 10 μM cisplatin or 0 to 5 μM doxorubicin in combination with 0 (black line) or 0.2 to 0.5 mg/mL (gray line) TCEE, respectively, for 48 hr. Cell viability was determined by MTT assay. Experiments were triplicated and data were presented as mean plus standard deviation. Data were presented as mean plus standard deviation.

