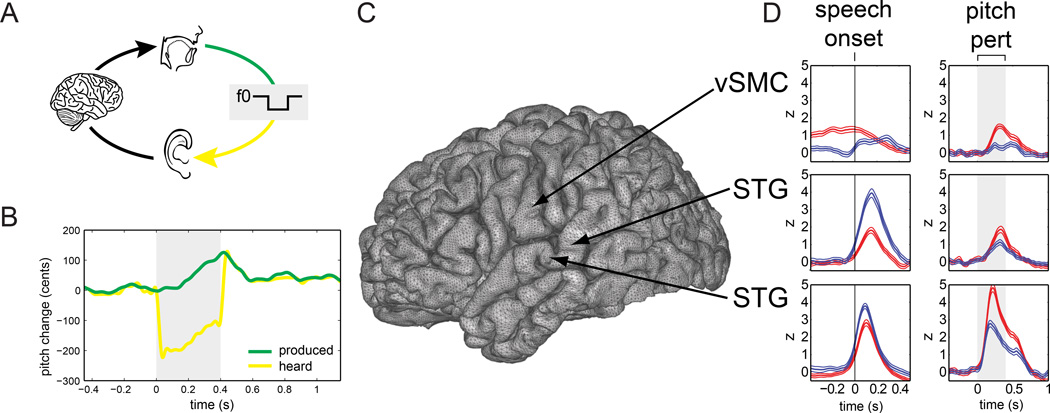
Figure 2.
Examples of SIS and SPRE during pitch perturbation of vocalization. (a) A DSP shifted the pitch of subjects’ vocalizations (green line) and delivered this auditory feedback (yellow line) to subjects’ earphones. (b) Pitch track of an example trial. The green line shows the pitch recorded by the microphone (produced) and the yellow line shows the pitch delivered to the earphones (heard). Shaded region shows time interval when DSP shifted pitch by 200 cents (1/6 octave). (c) Location of three electrodes on the cortical surface. (d) High-gamma line plots for each electrode in the speak (red) and listen (blue) conditions, with vertical lines in the left column of plots representing speech onset (where SIS [speak response < listen response] is observed) and shaded regions in the right column of plots representing perturbation onset and offset (where SPRE [speak response > listen response] is observed). Adapted from Chang et al., PNAS 2011.

