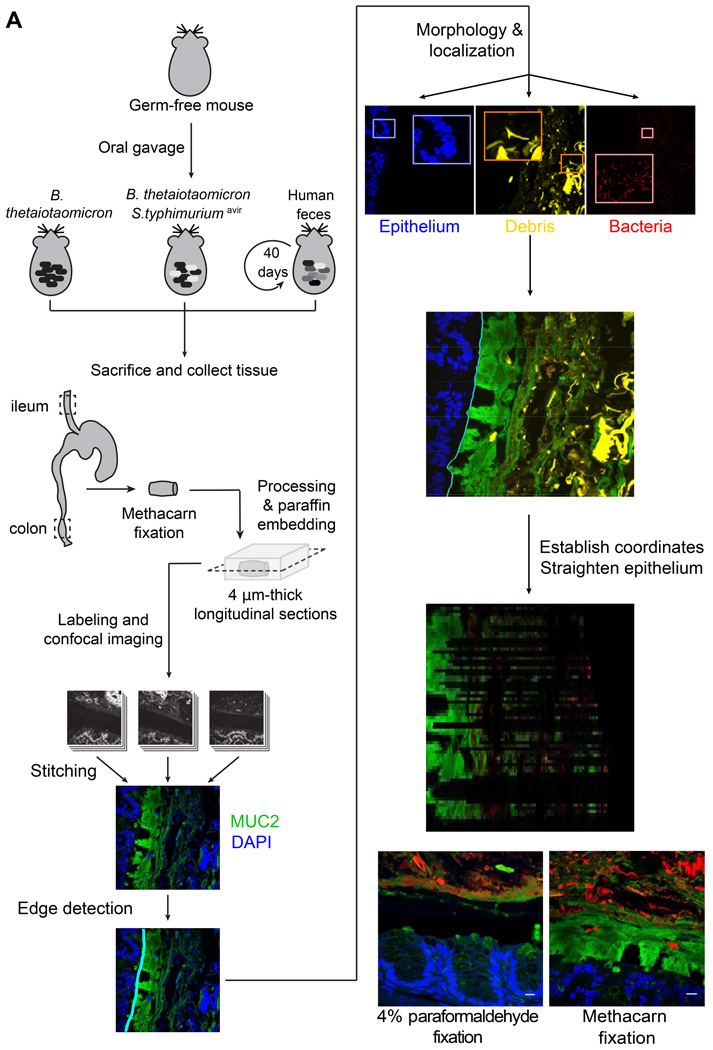
Figure 1. Preservation of the inner mucus layer in histological sections allows for quantitative analysis of the spatial structure of the gut ecosystem.
(A) Schematic of protocol for gnotobiotic mouse experiments, tissue collection and processing, image acquisition, and analysis.
(B,C) Segments of mouse distal colon fixed in (B) 4% paraformaldehyde or (C) methacarn solution. Blue, DAPI staining in the epithelium; red, DAPI staining in lumen of gut, including bacteria and shed host nuclei (luminal debris has not been differentiated in this image); green, antibody staining for MUC2. Scale bars: 10 µm.

