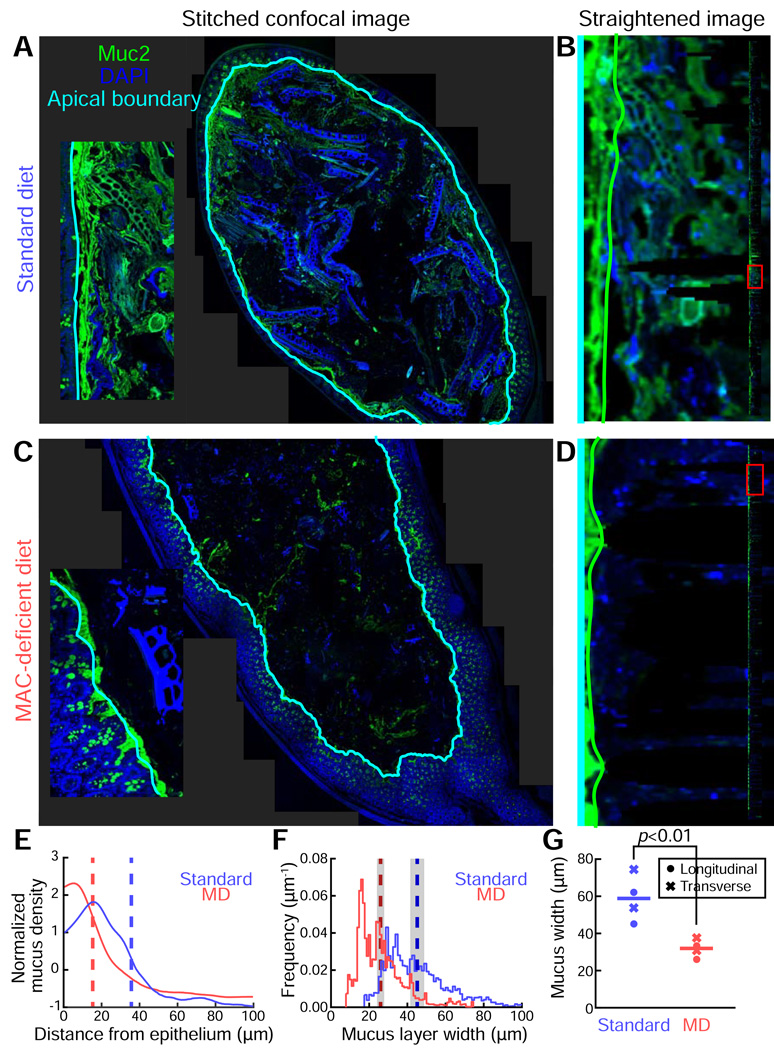
Figure 2. Large-scale image reconstruction of the distal colon enables quantification of mucus thickness and variability within a sample and between dietary conditions.
(A,C) Stitched images (∼40) of the fecal pellet-containing distal colons of Bt-monocolonized mice fed a (A) standard diet or (C) an MD diet. Samples were stained with DAPI (blue) and a MUC2 antibody (green), and overlaid with the computationally identified apical boundary (cyan).
(B,D) Detection of the edge of the inner mucus layer (green line) along a short length of the epithelium, corresponding to the insets in (A) and (C), in mice fed (B) a standard diet or (D) an MD diet. Edges were detected via computational straightening of the image. Inset: full straightened image along boundary of an entire gut segment. The red box highlights the portion of the segment visualized in the main panel.
(E) Mucus density versus distance from the epithelium for the colon sections in (A) (blue) and (C) (red), averaged over the length of the epithelium. Curves are mean-subtracted and divided by the standard deviation for normalization. Dashed vertical lines mark the location of the maximum gradient, indicating the edge of the inner mucus layer.
(F) Distribution of mucus layer widths in the colon sections shown in (A) (blue) and (C) (red), measured along the boundary of the entire gut segment. Dashed vertical lines indicate the mean widths, and shaded regions indicate standard error of the mean, accounting for sample autocorrelation.
(G) Average mucus width for mice fed standard and MD diets. Circles indicated measurements taken from longitudinal sections, and crosses indicate measurements taken from transverse sections; each data point represents an individual mouse (n=4 mice per diet). Horizontal lines indicate average width. P-value reflects one-sided t-test.

