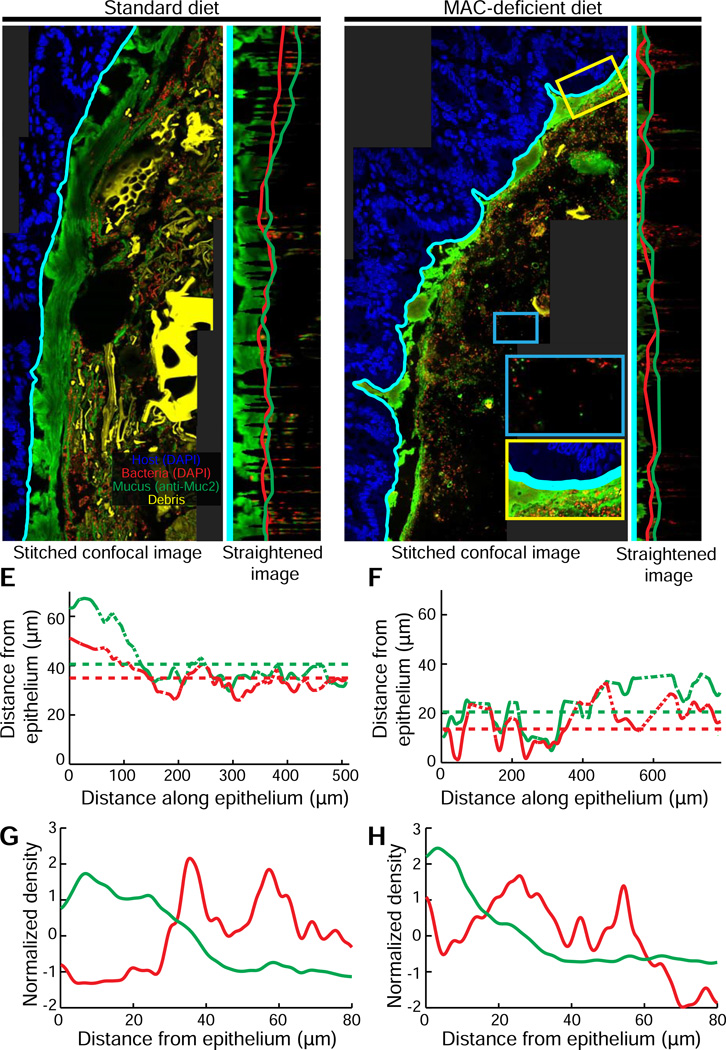
Figure 3. Diet change drives a shift in microbiota localization in the distal gut.
(A,C) Higher-resolution stitched images of the distal colon of Bt-monocolonized mice fed (A) a standard diet and or (C) an MD diet (C). Yellow inset (C): bacteria invading mucus layer. Blue inset (C): region far from the epithelium with few bacteria.
(B,D) Computationally straightened versions of the region of images shown in (A) and (C), respectively. Computationally determined edges defining the boundary of the inner mucus layer (green line) and the proximity to host epithelium of bacterial colonization (red line).
(E,F) Variation in width of inner mucus layer (green) and inner boundary of bacterial colonization (red) along the epithelium for mice fed (E) standard or (F) MD diets. Dashed portions of traces indicate regions where interpolation is required due to contour curvature. Dotted horizontal lines indicate the average widths (excluding interpolated points).
(G,H) Density, as determined by fluorescent intensity, of bacteria (red line) and mucus (green line) plotted in distance away from the epithelium for mice fed a (G) standard or (H) MD diet. Curves are mean-subtracted and divided by the standard deviation for normalization.

