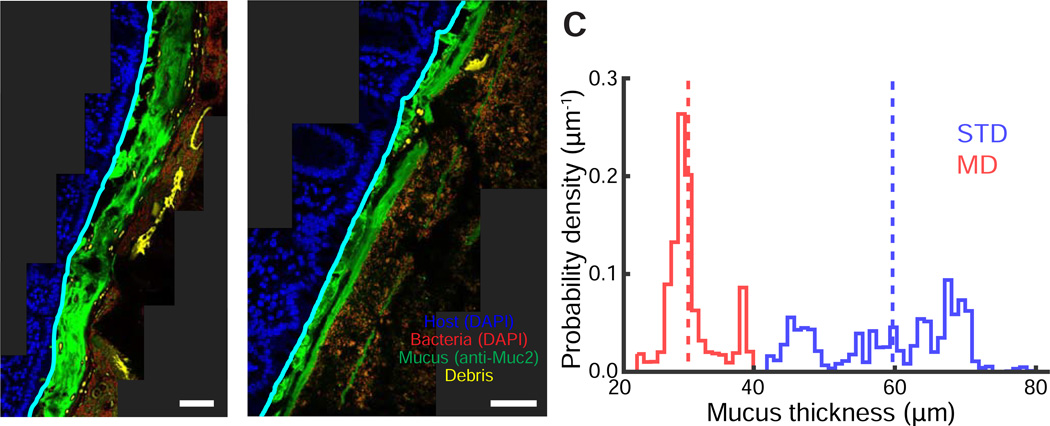
Figure 4. Diet changes affect the spatial organization of a complex intestinal community.
(A,B) Distal colon sections from humanized mice fed a (A) standard or (B) MD diet. Sections were stained with DAPI (epithelial signal, blue; luminal signal, red) and with MUC2 antibodies (green). Computed epithelial boundary is outlined in cyan, and debris appears in yellow.
(C) Distribution of mucus layer thickness in mice fed a standard (blue) or MD (red) diet. Dashed line represents the mean. Images are representative of two imaged mice per condition; replicates are shown in Fig. S3.

