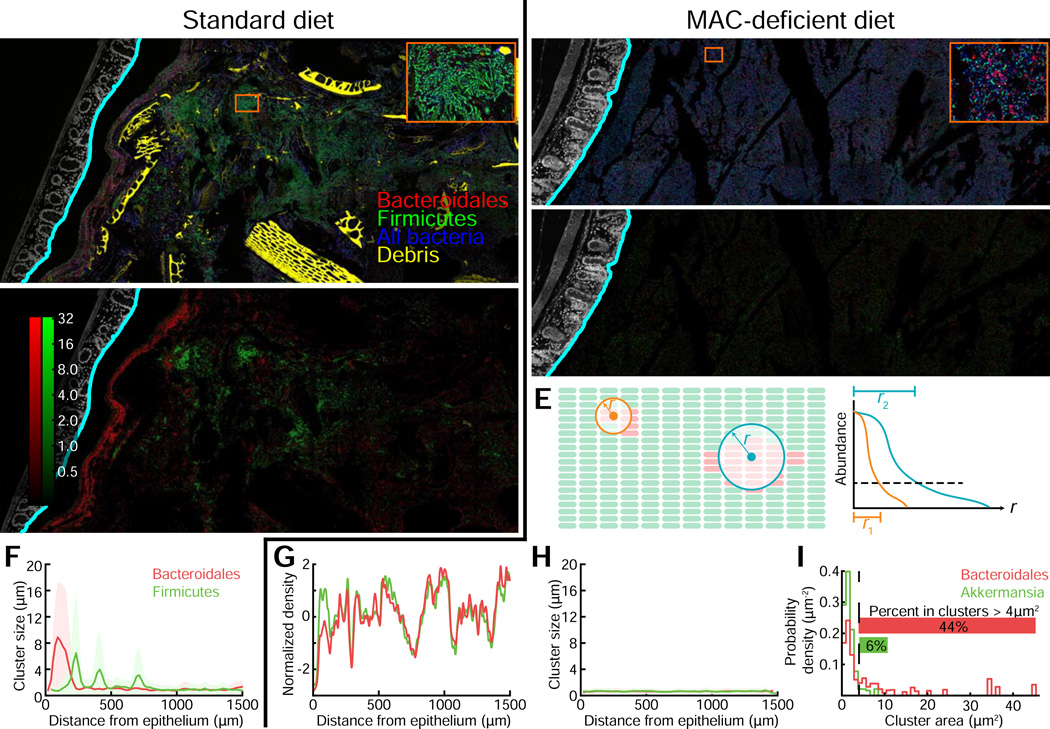
Figure 5. Diet changes affect clustering and mixing of a complex intestinal community.
(A,B) Distal colon sections from humanized mice fed a (A) standard or (B) MD diet. Sections were stained with DAPI (epithelial signal, white; luminal signal, blue), and FISH probes Bac303 (Bacteroidales, red) and LGC354A–C and Erec482 (Firmicutes, green). Computed epithelial boundary is outlined in cyan, and debris appears in yellow. Insets show a large Firmicutes cluster (A) and small Bacteroidales clusters (B). Images are representative of two imaged mice per condition; results for replicates are shown in Fig. S6.
(C,D) Pixel intensity corresponds to measured cluster size in images (A) and (B), respectively, for Bacteroidales (red) and Firmicutes (green). Intensities are on a log scale for clarity, and the same color scale is used for both images.
(E) Schematic of cluster size calculation: for each probe, the fluorescence signal in neighborhoods of increasing radii was integrated. For a small cluster (orange), the signal decays rapidly with increasing radius. For a large cluster (blue), the signal decays more slowly with increasing radius.
(F,H) Mean cluster size of Bacteroidales (red) and Firmicutes (green), computed as in (C-E), versus distance from epithelium, for mice fed a (F) standard or (H) MD diet. Shaded regions indicate the standard deviation of cluster widths. For computing means, a bin size of 20 µm was used.
(G) Density of Bacteroidales (red) and Firmicutes (green) as a function of distance from epithelium for mice fed an MD diet. Curves were mean-subtracted and divided by the standard deviation for normalization. Solid lines are measured from samples in (A) and (B).
(I) Distribution of Akkermansia and Bacteroidales cell clump sizes in MD-fed humanized mice. An area threshold of 4 µm2 (dotted line) was used to classify clusters vs. single cells.

