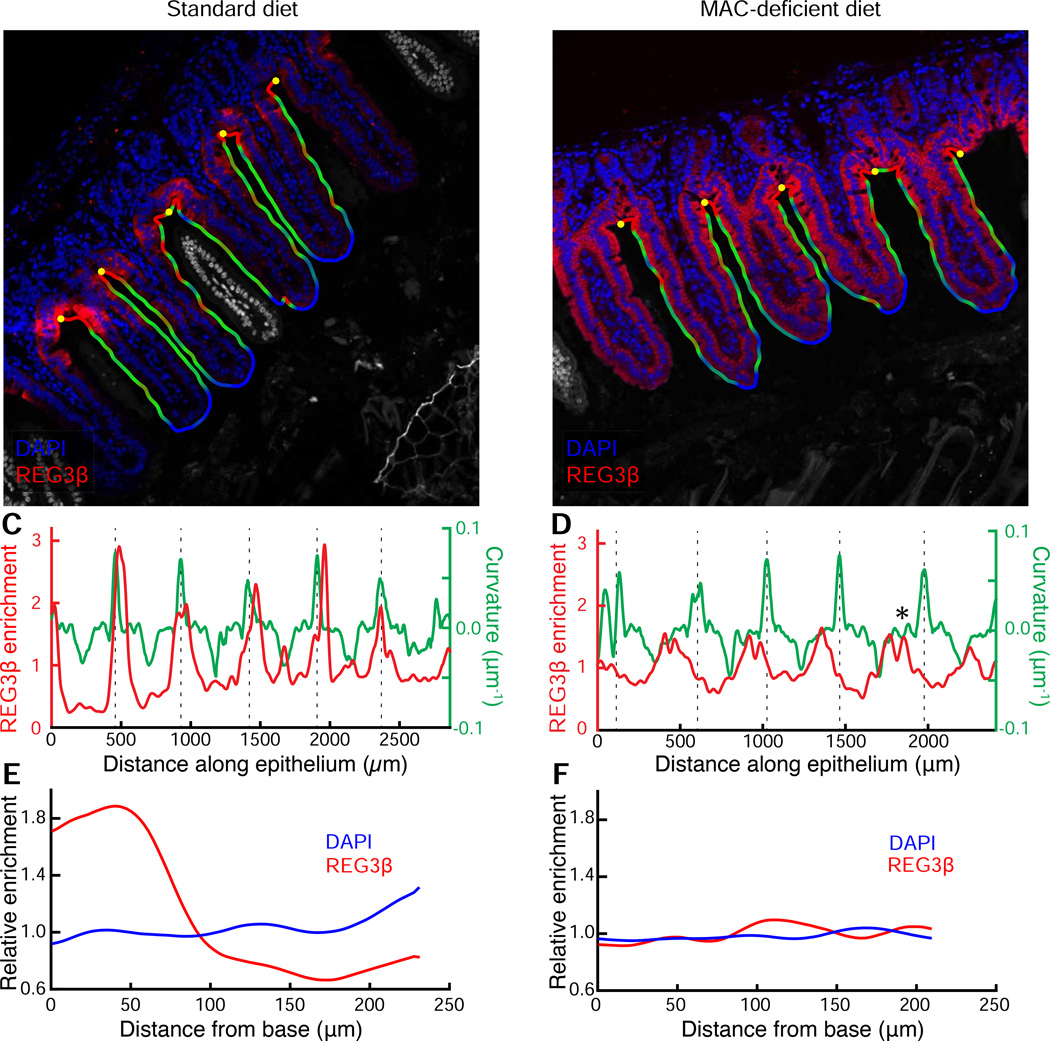
Figure 6. Diet change alters the innate immune response in the ileum.
(A, B) Ileum of mice fed a (A) standard or (B) MD diet. Samples were stained with DAPI (blue) and REG3β antibody (red). The computationally identified outline is colored by contour curvature, and the computationally identified base of the villi is shown with yellow dots. The region outside the contour, including villi that are not continuous with the imaged epithelium due to sectioning angle, are colored gray. Images are representative of two imaged mice per condition; results for replicates are shown in Fig. S7, A-F.
(C, D) Variation in enrichment of REG3β normalized to the mean, as determined by fluorescence intensity (red) and curvature of epithelial contour (green) along the length of the epithelium. Dashed lines indicate the base of the villi. Asterisk in (D) indicates an example of a maximum in REG3β signal that is not associated with a maximum of curvature.
(E, F) Distribution of REG3β signal (red) and cell nuclei (DAPI, blue) relative to the base of the villi in a (E) standard or (F) MD diet.

