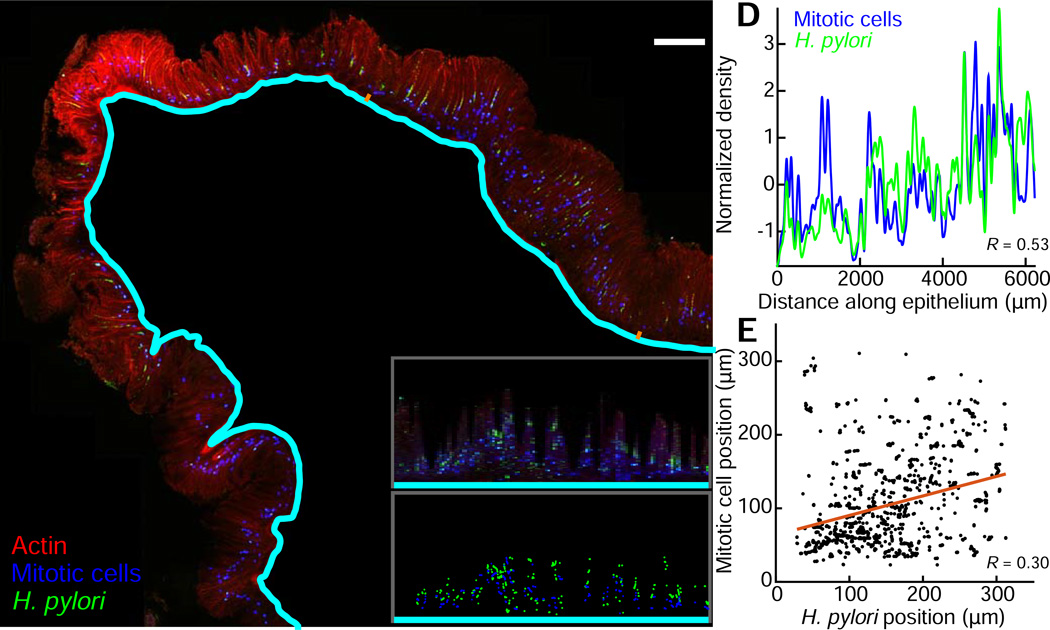
Figure 7. BacSpace reveals spatial coordination between H. pylori gastric gland colonization and mitotic progenitor cell division in the stomach.
(A) Longitudinal section of the stomach antrum two weeks post infection with Hp. F-actin is stained with phalloidin (red), and Hp (green) and phospho-Histone-H3 (blue, indicating mitotic cells) are visualized by immunolabeling. BacSpace detection of the mucosal boundary appears in cyan. Images and quantification are representative of two imaged mice; results for replicates are shown in Fig. S7, G-H.
(B) Computationally straightened segment of the section in (A), corresponding to the epithelial region marked by orange dashes in (A).
(C) Median distance from the mucosal boundary of Hp (green dots) and mitotic nuclei (blue dots) for positions in (B) along the epithelium in which both Hp and mitotic cells are detected.
(D) Variation in density (normalized by z-score) of Hp (green) and mitotic cells (blue) along the length of the antrum indicates correlation (Pearson correlation coefficient 0.53) between the Hp and mitotic cell fluorescence in the direction away from the submucosal boundary.
(E) Average distance from submucosal boundary of Hp and mitotic cells at positions along the antrum for which both are present.

