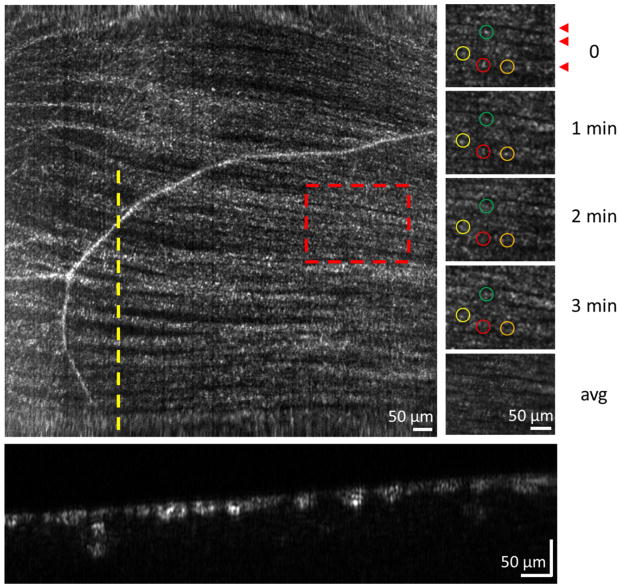
Figure 2.
Imaging axonal activity in a human eye. (Left) MHz AO-OCT en face projection of RNFL bundles centered 3.5° nasal to the fovea. I mage is from a single volume acquired at a rate of 1 million A-lines/s (1 MHz), covering 3.6°x3.6° with 1 μm/pixel lateral sampling.(Kocaoglu et al., 2014b) (Right) Time sequence of a subsection of RNFL bundles from the red dashed region of the left image. Colored labels denote bundle locations at which reflectance was measured every minute over a 3 minute period. Bottom image of column is an average of the four time points. Red arrowheads at t=0 point to individual RNFL bundles. (Bottom) Cross section of RNFL bundles extracted at the location of the yellow dashed line in the left image. Figure courtesy of Zhuolin Liu, Omer Kocaoglu and Don Miller, Indiana University.

