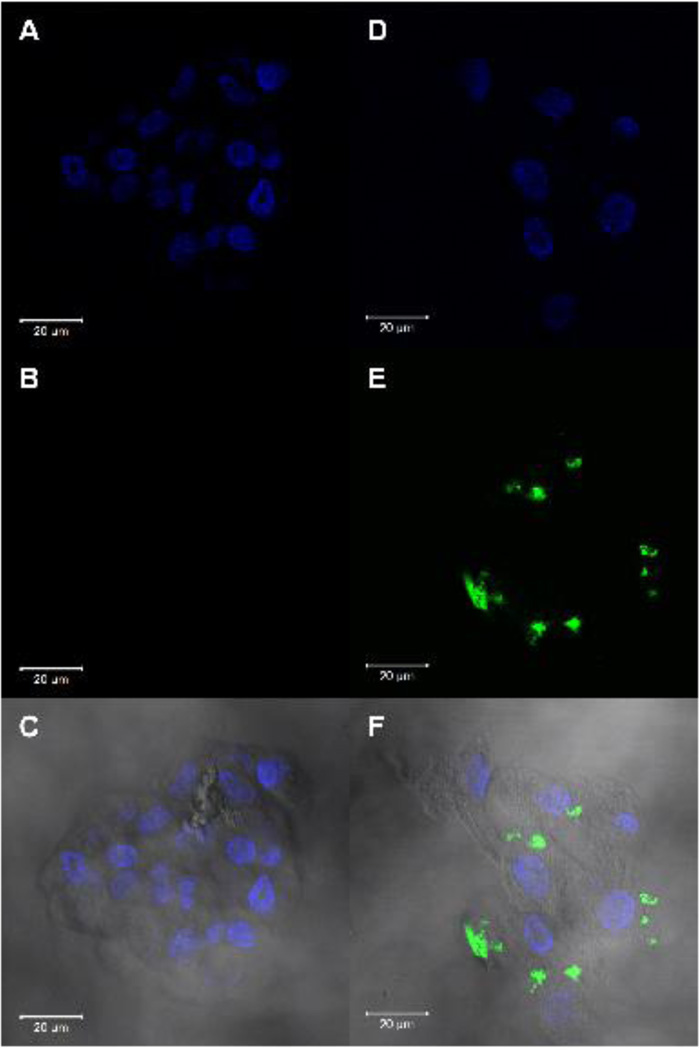
Fig 2. CRFP Localization.
Confocal microscopic imaging of hMSC treated with FITC-CRFP and FITC-Ab (negative control), counterstained with DAPI to show nuclei. A) Epifluorescence imaging of DAPI on control slide. B) Epifluorescence imaging of FITC on control slide. C) Overlay of DAPI, FITC, and brightfield images on control slide. D) Epifluorescence imaging of DAPI on experimental slide. E) Epifluorescence imaging of FITC on experimental slide. F) Overlay of DAPI, FITC, and brightfield images of experimental slide. For all images, scale bar = 20µm.

