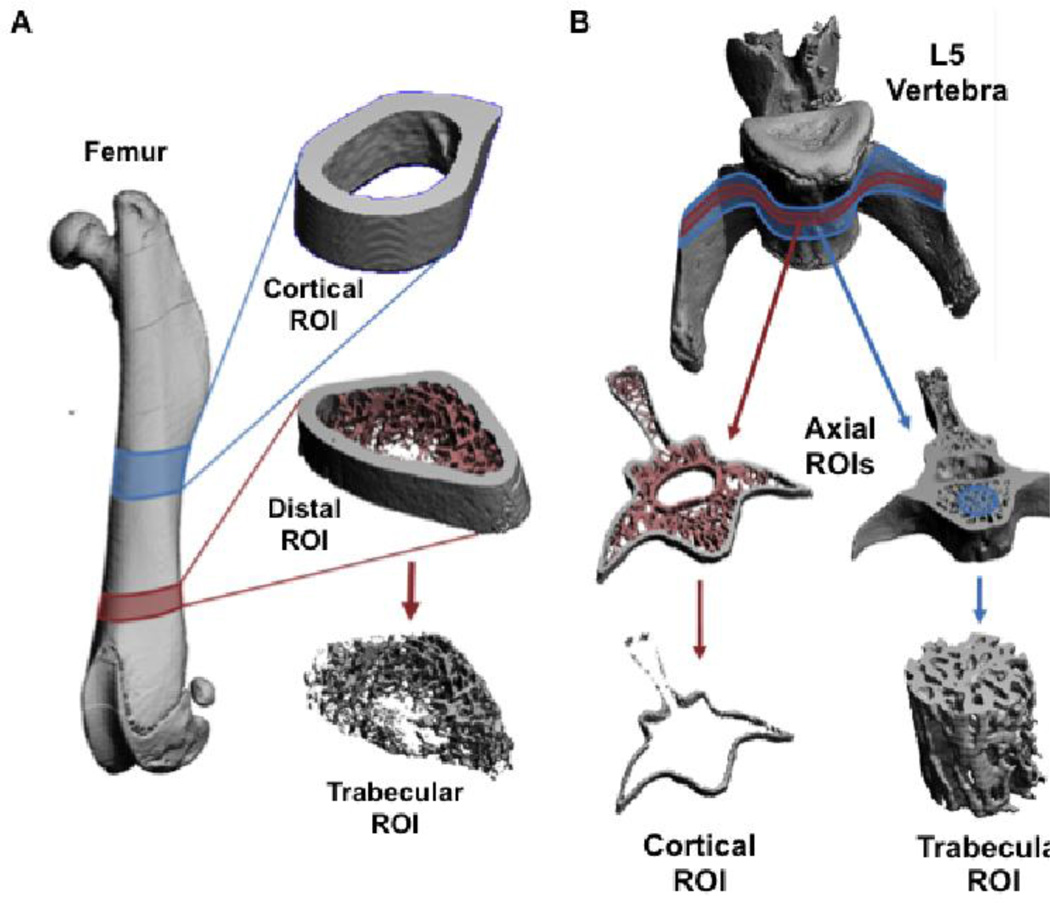
Fig 5. MicroCT Regions of Interest.
A) Surface rendered images from a microCT scanned femur and magnified views of the ROIs used for quantitative analyses. The location of the midshaft cortical ROI is highlighted in blue and that of the distal trabecular ROI is highlighted in red. The distal ROI is shown as a segmented image and as the isolated trabecular ROI. B) Surface rendered images from a microCT scanned L5 vertebra with magnified views of the ROIs used for quantitative analyses. A thin axial ROI, highlighted in red, was segmented to remove the trabecular bone and isolate the cortical ROI. A thicker axial ROI, highlighted in blue, had a cylinder positioned through the vertebral body to isolate the trabecular ROI.

