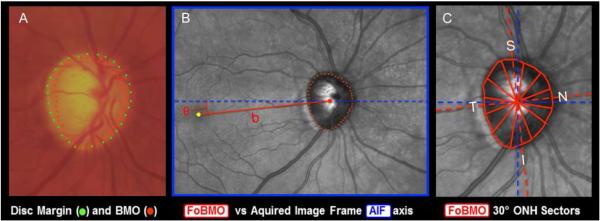
Figure 1. OCT Phenotyping in the NHP EG Model Part 1: BMO and FoBMO Axis Anatomy vs the Clinical Disc Margin and the Acquired Image Frame.

(A) While in the NHP eye, OCT-detected Bruch’s Membrane Opening (BMO – red points) can be the same as the clinically visible Disc Margin (green points) (Strouthidis et al., 2009b), BMO can also be regionally invisible and anatomically different from the Disc Margin (Reis et al., 2012b; Strouthidis et al., 2009b). (B) The Foveal –BMO centroid (FoBMO) (red) vs Acquired Image Frame (AIF - blue) Temporal-Nasal axis (He et al., 2014a). (C) FoBMO ONH 30° sectors.(He et al., 2014a) By colocal izing all forms of fundus imaging to the infrared image acquired at the time of OCT data set acquisition, FoBMO axis anatomy and regionalization can be superimposed upon all in-vivo and post-mortem data sets (Lockwood et al., 2015). Digitally converting all left eye data sets into right eye (OD) configuration (Lockwood et al., 2015), and using FoBMO regionalization allows the most anatomically consistent EG vs. control eye comparisons within and between animals.
