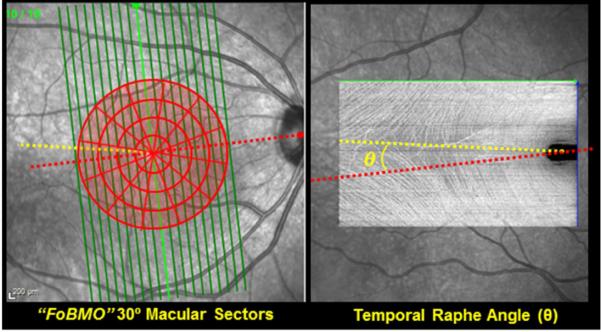
Figure 5. OCT Phenotyping in the NHP EG Model - Part 5: Phenotyping the Macula.

Automated Segmentation is available to make the following thickness measurements on most instruments: Nerve Fiber Layer (NFL), RGC complex (defined to be the distance between the internal limiting membrane (ILM) and the outer nuclear layer), RGC layer (RGC cell thickness, alone) and retinal thickness (ILM to Bruch’s membrane thickness). When high density grid scans are obtained, the temporal raphe can be identified within “enface” (C-scan) views of the NFL(Chauhan et al., 2014b) (right). The effect of using the temporal raphe versus the FoBMO axis as the “midline” for macula regionalization as well as multiple regionalization schemes (30° sectors & 500 micron intervals are shown - left) should be explored.
