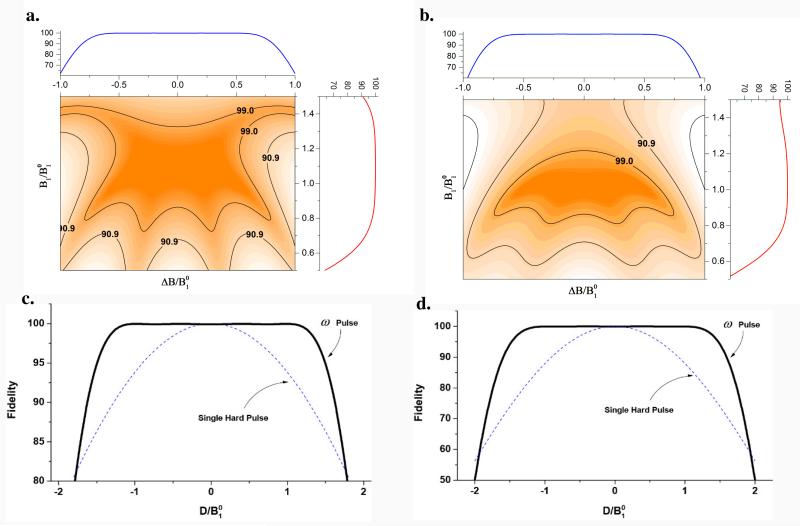
Figure 3.
Fidelity surface contours of the phase modulated π/2 (a) and π (b) pulses shown in Figure 1 with ‘relative resonance offset’ (ΔB/) and relative rf strength (B1/). Inner contour represents a fidelity of 99%. c and d shows change in fidelity (%) with relative zz interaction strength (D / ) π/2 and π pulses. Inner dotted line shows the response of single hard pulse of the same rf strength.

