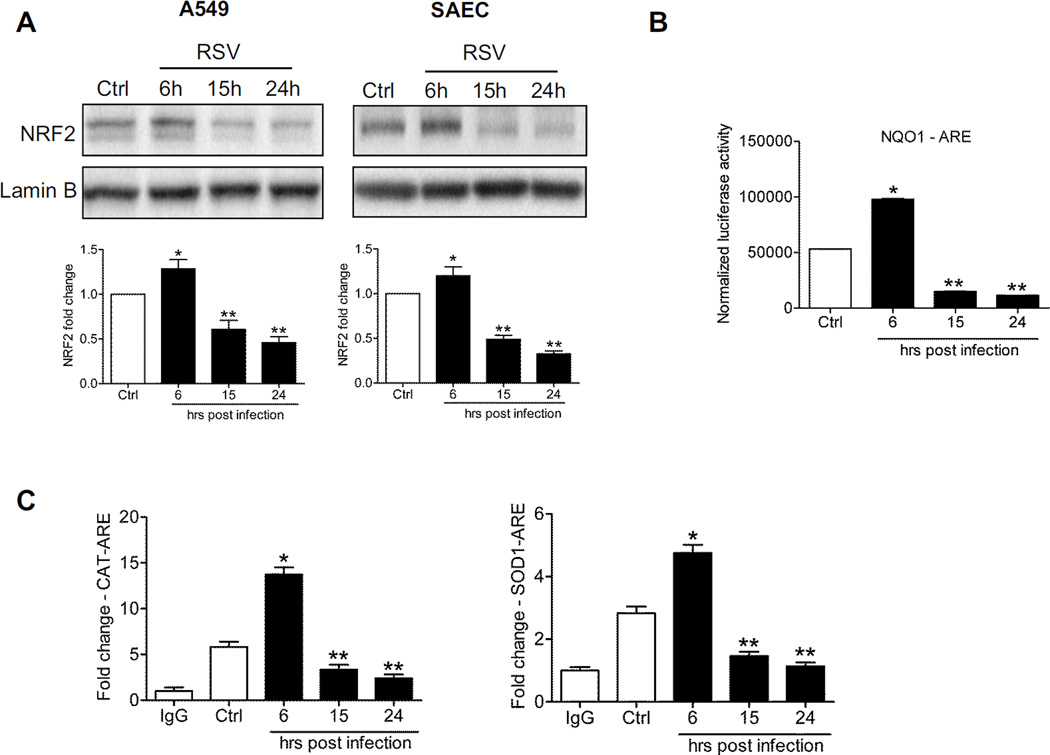
Figure 1. RSV infection down-regulates NRF2 dependent gene transcription.
(A) Nuclear proteins isolated from A549 cells (left panel) and SAECs (right panel) uninfected or infected with RSV for 6, 15 and 24h were subjected to Western blot analysis using anti-NRF2 antibody. For loading controls, membranes were stripped and re-probed with anti-Lamin B antibody. The blots are representative of three independent experiments. Densitometric analysis of NRF2 band intensity is shown after normalization to Lamin B. The groups were analyzed by one-way ANOVA followed by Tukey’s post-hoc test. Data are shown as mean ± SEM. *P < 0.05 relative to uninfected cells, **P < 0.05 relative to uninfected and 6h infected cells. Open bars represent uninfected (control, Ctrl) and solid bars represent RSV infected cells. (B) A549 cells were transiently transfected with an ARE driven luciferase reporter plasmid, infected with RSV for various lengths of time, and harvested to measure luciferase activity. Data are representative of three independent experiments. The groups were analyzed by one-way ANOVA followed by Tukey’s post-hoc test. Data are shown as mean ± SEM. *P < 0.05 relative to uninfected cells, **P < 0.05 relative to uninfected and 6h infected cells. (C) ChIP-QgPCR analysis of NRF2 occupancy of endogenous ARE promoter sites. Chromatin DNA from A549 cells uninfected or infected with RSV for 6, 15 and 24h was immunoprecipitated using anti-NRF2 antibody or IgG as negative control. QgPCR was performed using primers spanning the ARE binding site of the catalase (left) and SODl (right) gene promoter. Total input chromatin DNA for immunoprecipitation was included as positive control for QgPCR amplification. Fold change was calculated compared to IgG control. Data are representative of three independent experiments. The groups were analyzed by one-way ANOVA followed by Tukey’s post-hoc test. Data are shown as mean ± SEM *P < 0.05 relative to uninfected cells, **P < 0.05 relative to uninfected and 6h infected cells.

