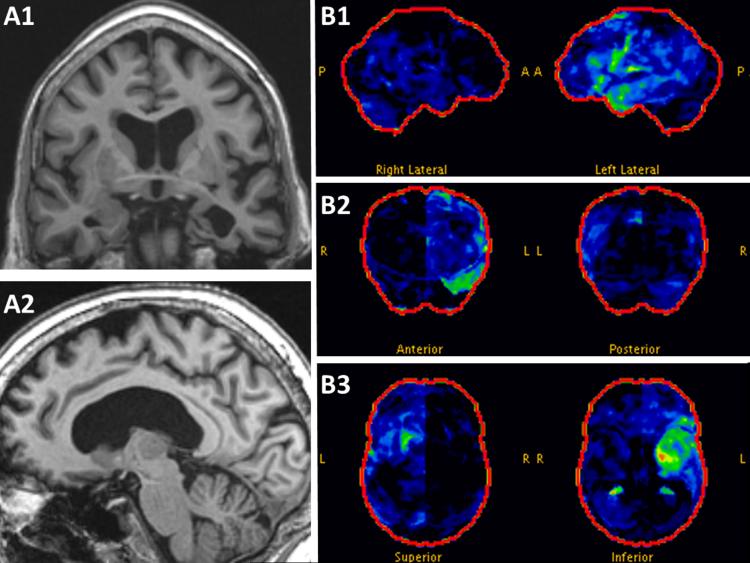
Figure 1. MRI and FDG-PET imaging.
Magnetization-prepared rapid acquisition with gradient-echo (MP-RAGE) images show left mesial temporal atrophy on coronal images (A1) and medial pre-central atrophy on sagittal images (A2). FDG-PET measuring glucose metabolism (green = mild hypometabolism; yellow=moderate hypometabolism; red=severe hypometabolism) shows mostly mild hypometabolism in the left anterior temporal lobe and left inferior frontal region (B1) which is also evident on coronal (B2) and axial images (B3). Abbreviations: A, anterior; L, left; P, posterior; R, right.

