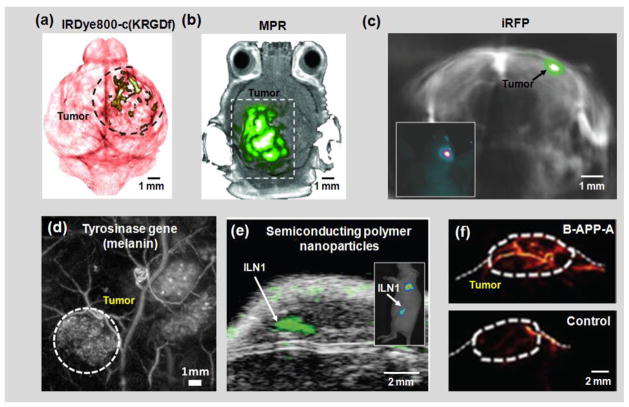
Figure 4. Molecular PAT.
(a) PAT of a glioblastoma in a mouse brain enhanced by IRDye800-c(KRGDf), which targeted overexpressed integrin αvβ3 in tumor cells [7]. (b) PAT of a glioblastoma in a mouse brain enhanced by tri-modality MRI-PA-Raman (MPR) nanoparticles [209]. (c) PAT of an iRFP-expressing glioblastoma in a mouse brain, 25 days post implantation [160]. The spectrally unmixed signals from the tumor (shown in green) are superimposed on the signals from blood (shown in gray). iRFP, infrared fluorescent protein. Inset: epi-fluorescence image of the mouse brain showing the tumor location. (d) PAT of a subcutaneous tyrosinase-expressing tumor [210]. The tumor is marked by the dashed circle. (e) Ultrasound (shown in gray) and photoacoustic (shown in green) co-registered image of mouse lymph nodes following tail vein injection of semiconducting polymer nanoparticles (SPN) [211]. ILN, inguinal lymph node. Inset: epi-fluorescence image of the mouse showing the ILN location. (f) PAT of the activatable B-APP-A in a FTC133 tumor in the mouse hind leg after tail vein injection of B-APP-A (top) and the control probe (bottom) [54]. Images were adapted with permission from references [7, 54, 160, 209–211].

